Updated June 7, 2023
Moving Averages in Excel
Moving Averages in Excel are used to find the average of rolling iteration data using the AVERAGE function in multiple iterations. Moving average smooths the discrepancies in the data, which may have multiple ups and downs. We can use an inbuilt application for Moving Average, accessed from the Data Analysis option under the Data menu ribbon. For this, select the input range and the output cell; this will automatically return the smoothened moving average data. If we want to use the AVERAGE function, choose at least the last 3 iteration data. The Average moving method is widely used in Demand Forecasting, the Prediction of the next value in many fields.

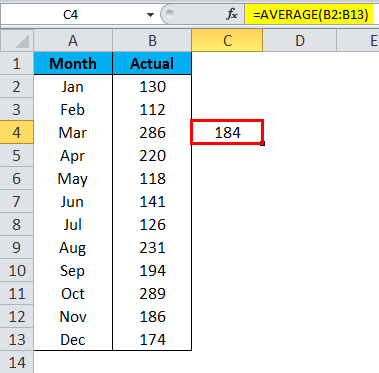
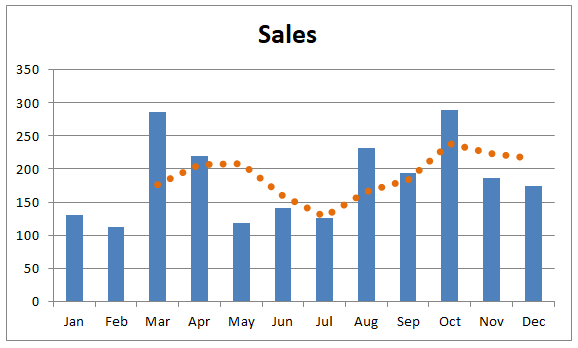
The overall average of the 12 months’ sale is 184.
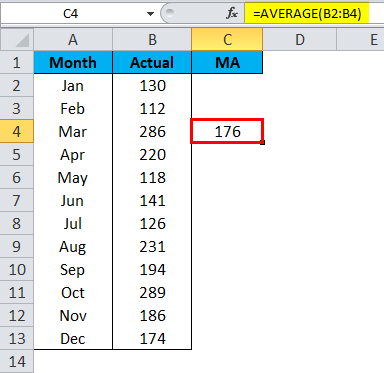
But the moving average is a little bit different here. Firstly excel moving average will calculate the average for the first three months, i.e., Jan, Feb, and Mar month.
Then it will leave out Jan for the next average calculation and takes only Feb, Mar, and April month data.
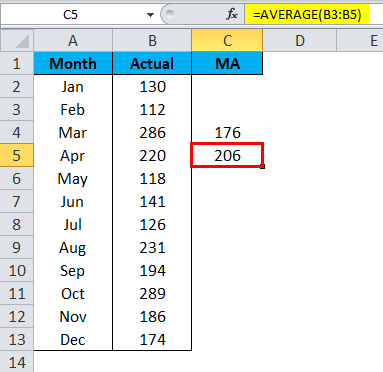
Like this moving average technique is considered in the latest data series to identify the trend of the data.
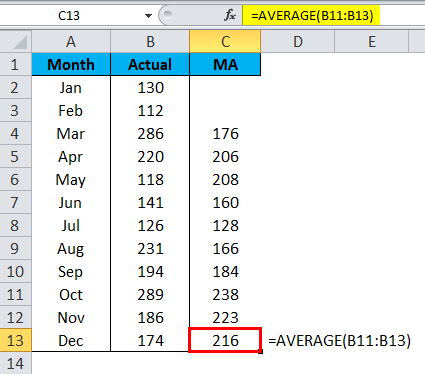
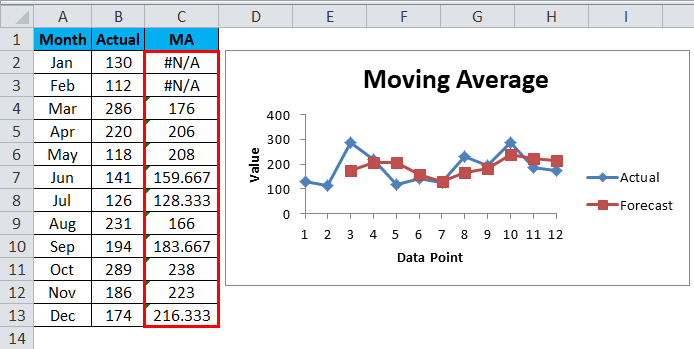
The overall average showed a trend of 184, but the moving average was 216 based on the latest month’s data.
Types of Moving Averages
Different moving averages are available, like exponential, variable, triangular, weighted, and simple moving averages. The most commonly used technique is the Simple Moving Average.
Where to Find Moving Average in Excel?
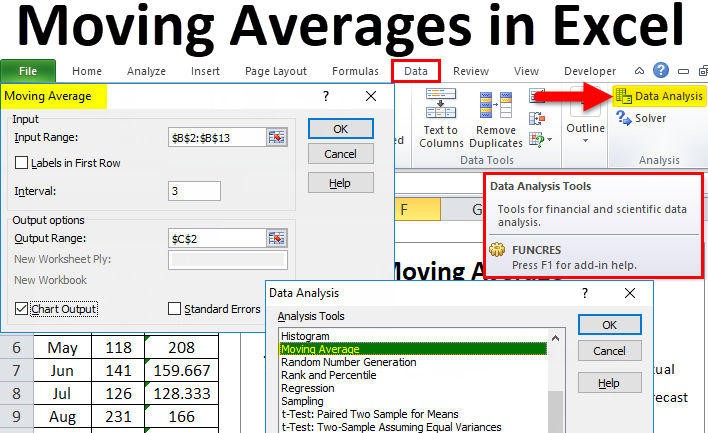
Moving Average is one of the many Data Analysis tools for Excel. We do not get to see this option in Excel by default. Even though it is an in-built tool, it is not readily available to use and experience. We need to unleash this tool. If your Excel is not showing this Data Analysis Toolpak, follow our previous articles to unhide this tool.
After unhiding the Data Analysis Toolpak, you will see this under the DATA tab in Excel.
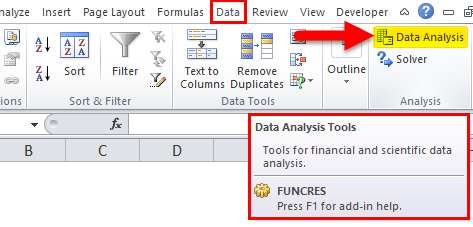
Click on Data Analysis to see all the available tools under this tool. We have so many techniques under this belt; we will concentrate only on the Moving Average technique.
How to Calculate Moving Averages in Excel?
Calculating moving averages in Excel is very simple and easy. Let’s understand the calculation of moving averages in Excel with some examples.
Example #1
We have already seen how moving average works with the simple sales data series. With the help of the average formula, we have calculated the Excel moving average trend, but in this example, I will calculate the moving average under the Data Analysis tool.
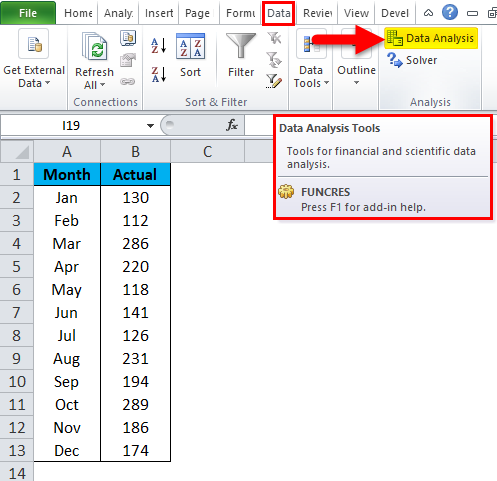
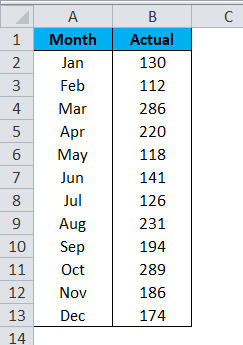
Step 1: I will take the same data as above.

Step 2: Go to Data and Click on Data Analysis.
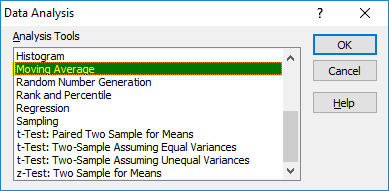
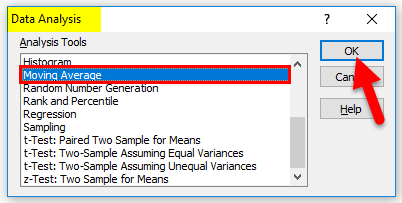
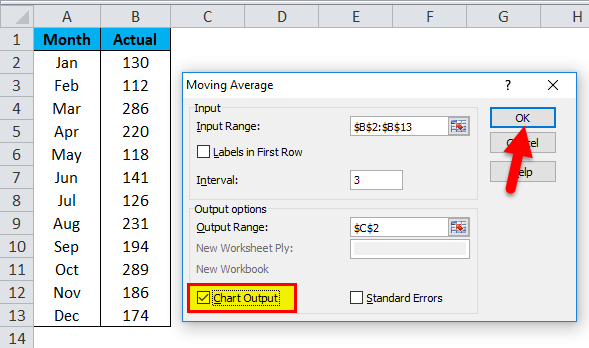
Step 3: It will open a Data Analysis dialog box. Scroll down and select the Moving Average option and click on OK.
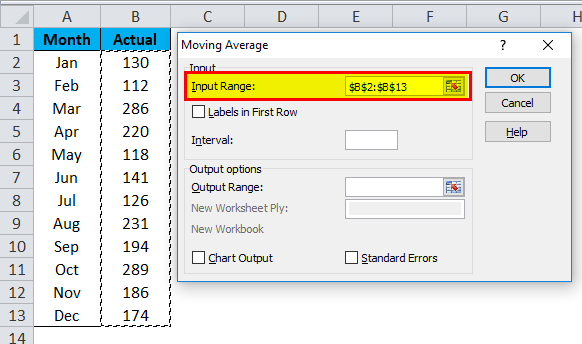
Step 4: Select the sales data from B2 to B13 for Input Range. We have not selected the heading, so leave Labels in the First Row check box.
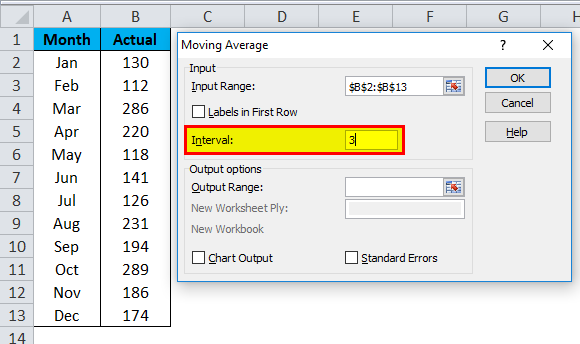
Step 5: Under Interval, we need to mention how many months we need to take out the average. I will mention the interval as 3.
Step 6: Select the Output Range cell as a C2 cell.
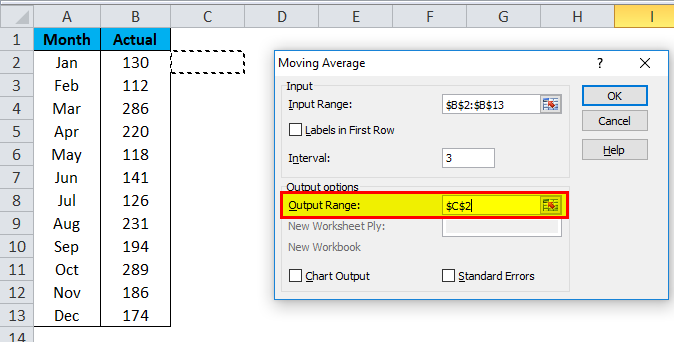
Step 7: Select the Chart Output if you need a chart to show the trend. Click OK to complete the moving average calculation.
Step 8: Now, we have results from C2 to C13. The first 2 cells show #N/A because we have selected the interval as 3 from the 3rd cell onwards; we have results.
Example #2 – Create a Moving Average Chart
Now we understand the concept of moving averages. We can create a moving average chart without calculating the moving averages.
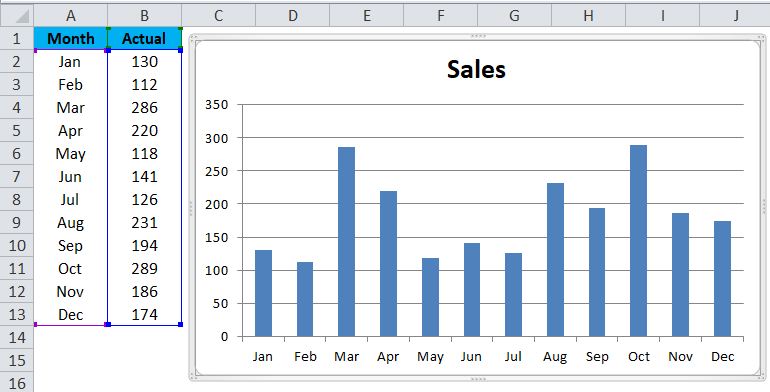
Take the same data for creating a chart.
Step 1: Select the data and insert the column chart.
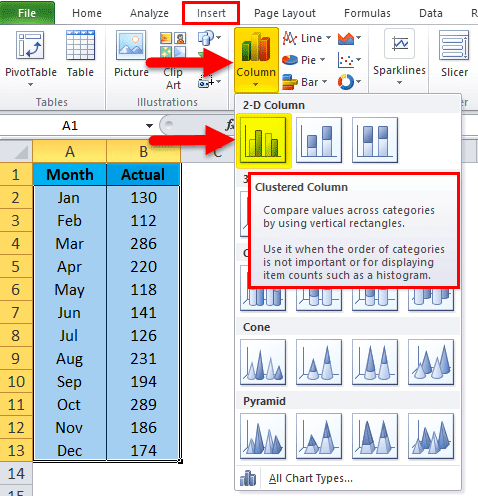
Step 2: The chart will look as below:
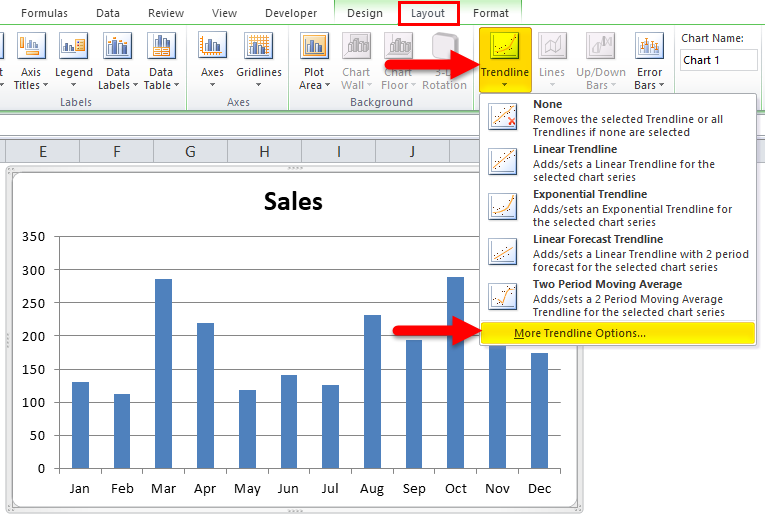
Step 3: Select the chart to Layout > TrendLine > More Trendline Options.
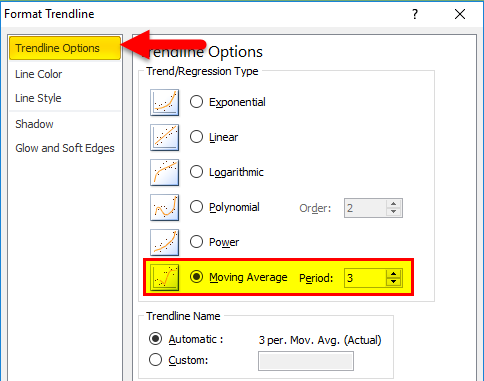
Step 4: On the right-hand side, you will see TrendLine Options. Select Moving Average and make the Period as 3.
Step 5: Now, the chart has a moving average line.
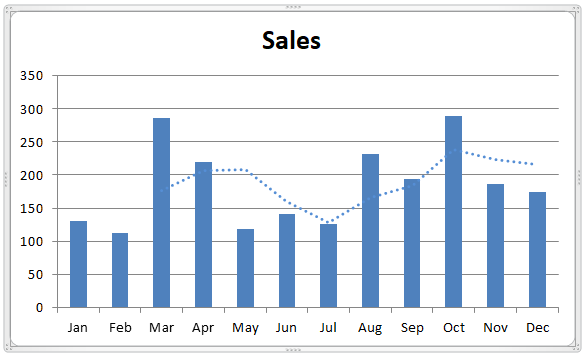
Step 6: Make the line solid and change the color.
Things to Remember
- We need to specify for how many months we are finding the moving average.
- Based on the recent trend, we can make accurate decisions.
- Labels need to be selected if the input range includes headings.
Recommended Articles
This has been a guide to Moving Averages in Excel. Here we discuss its types and how to calculate moving averages in Excel, along with Excel examples and a downloadable Excel template. You may also look at these useful charts in Excel –
