Updated August 24, 2023
Excel Venn Diagram (Table of Contents)
Introduction to Venn Diagrams in Excel
A Venn diagram is a diagram or illustration of the relationships between and among sets (different groups of objects). It is a pictorial representation of logical or mathematical sets drawn in an enclosing rectangle (rectangle representing the universal set) as circles.
Each circle represents a set, and the points inside the circle represent the elements of the set. The interior of the circle represents elements that are not in the set. Common elements of the sets are represented as intersections of the circles. Venn diagrams are called so as John Venn invented them.
How to Create Venn Diagram in Excel?
Let’s understand how to Create Venn Diagram in Excel with a few examples.
Example #1
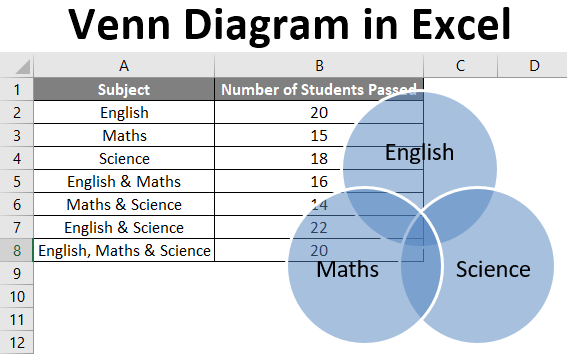
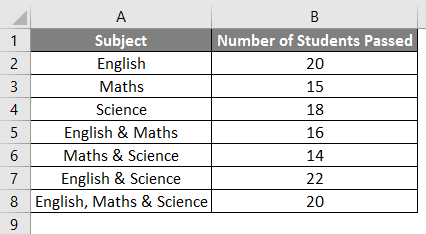
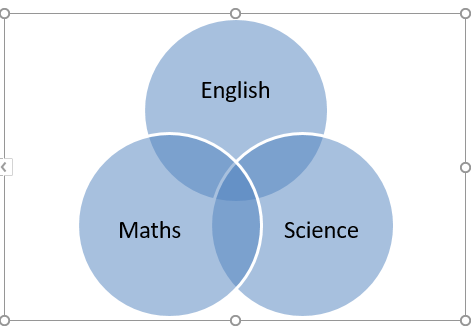
Let’s say we wish to draw a Venn diagram for the number of students who passed (out of 25) in Maths, English, and Science. We have the following students’ data in an Excel sheet.
The following steps can be used to create a Venn diagram in Excel.
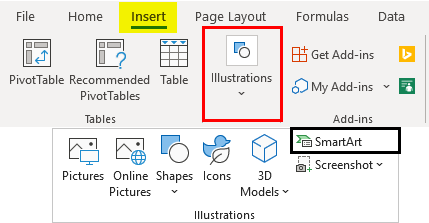
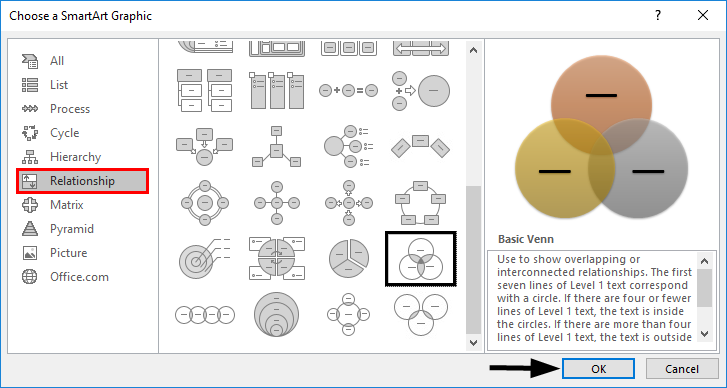
- Click on the ‘Insert’ tab and then click on ‘SmartArt’ in the ‘Illustrations’ group as follows:
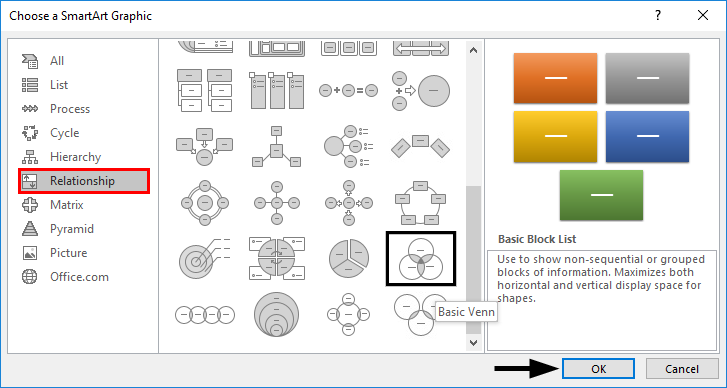
- Now click ‘Relationship’ in the new window, select a Venn diagram layout (Basic Venn), and click ‘OK.
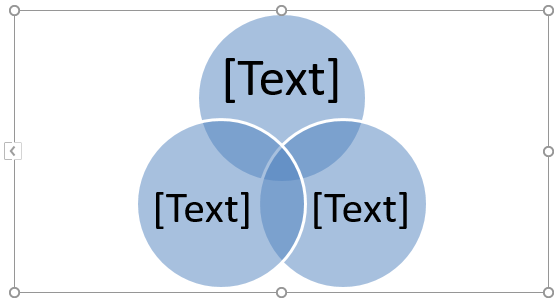
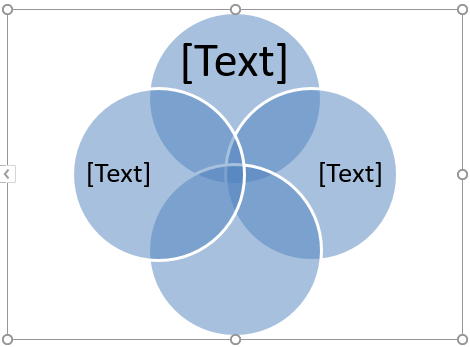
- This will display a Venn diagram layout as follows:
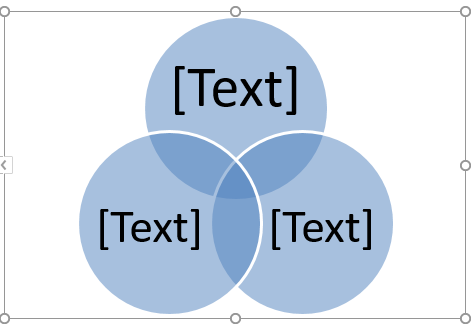
- Now the text on the circles can be changed by clicking on [Text] in the Text pane in circles and then renaming it to depict what the circles represent.
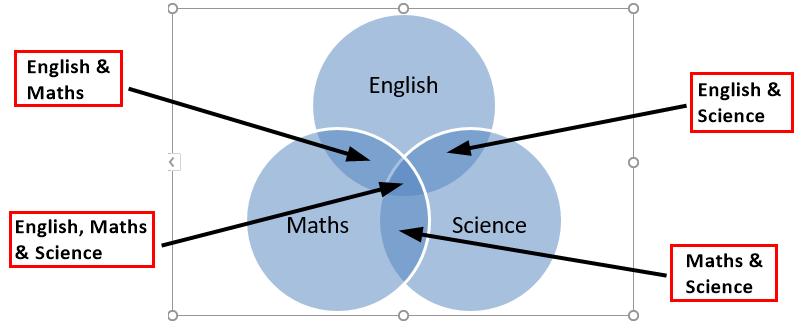
- We can add text in overlapping portions of the circles by inserting a text box.
Example #2
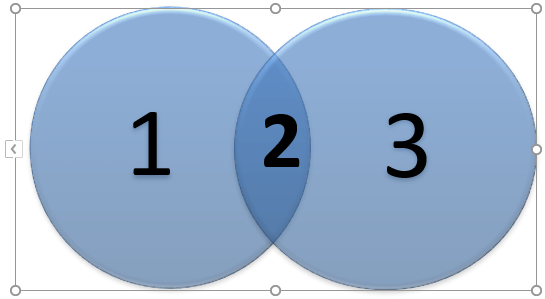
Let’s say there are two sets A & B defined as A= {1, 2}, and B= {2, 3}, and we wish to find A U B (A union B). A union is defined as something present in either of the groups or sets.
So A U B means the elements or numbers from A or B.
- A U B= {1, 2} U {2, 3}
- A U B= {1, 2, 3}
So let’s see how this can be represented in a Venn diagram.
- Click on the ‘Insert’ tab and then ‘SmartArt’ in the ‘Illustrations’ group.
- Now click on ‘Relationship’ in the new window, select a Venn diagram layout (Basic Venn), and click ‘OK.
- This will display a Venn diagram layout as follows.
We can also choose ‘Linear Venn’ instead of the ‘Basic Venn’ layout and then delete some circles. Since there are only two sets (A & B) in this case, we delete one of the circles from the Venn diagram as follows.
- Click one of the circles and press the ‘Delete’ button. This will lead us to a Venn diagram below:
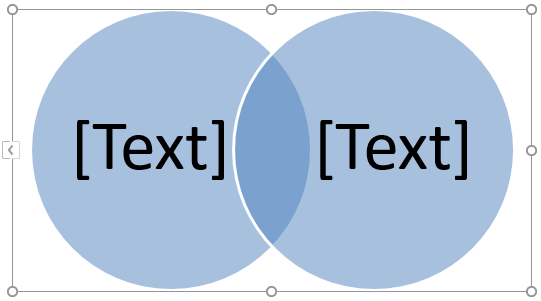
- Now the text on the circles can be changed by clicking on [Text] in the Text pane in circles and then renaming it to depict what the circles represent.
Like Union, another term generally used for sets is ‘Intersection’, which means something present in all groups or sets.
So, in this case, An intersection B (A ∩ B) would be numbers or elements present in both A & B.
- A ∩ B= {2}
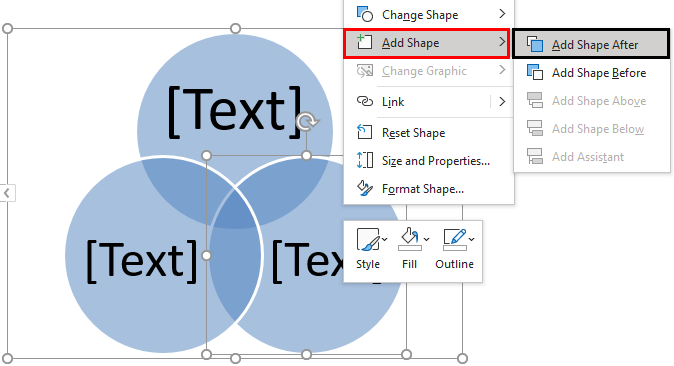
Just like deletion, we can add circles to the Venn diagram by following the steps below.
- Right-click the existing circle closest to where the new circle is to be added. Now click on ‘Add Shape’, and then click on ‘Add Shape After’ or ‘Add Shape Before’.
After adding the shape, the output is shown below.
Example #3
Let’s say there are two sets A & B defined as A= {1, 3, 5} and B= {1, 2, 3, 4, 5, 6}, and we wish to find A U B (A union B). So as seen in the above example, A U B means the elements or numbers from either A or B.
- A U B= {1, 3, 5} U {1, 2, 3, 4, 5, 6}
- A U B= {1, 2, 3, 4, 5, 6}
So let’s see how this can be represented in a Venn diagram.
- Click on the ‘Insert’ tab and then ‘SmartArt’ in the ‘Illustrations’ group as follows.
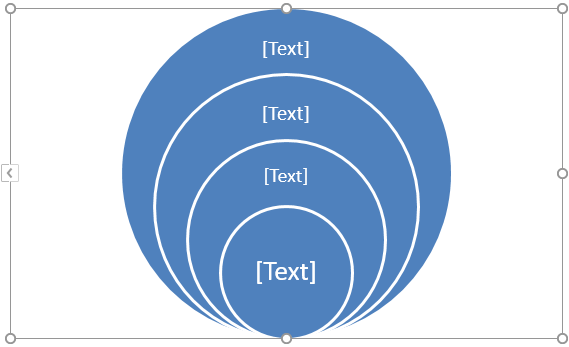
- Now click on ‘Relationship’ in the new window, select a Venn diagram layout (Stacked Venn), and click ‘OK.
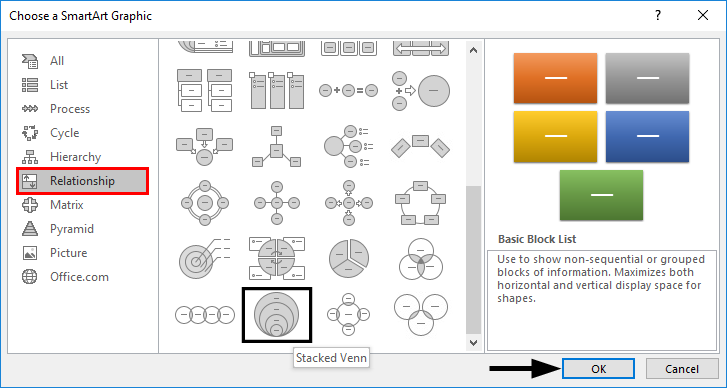
- This will display a Venn diagram layout as follows.
Since there are only two sets (A & B) in this case, we delete the extra circles from the Venn diagram by right-clicking on them and pressing ‘Delete’. This will lead us to a Venn diagram as below.
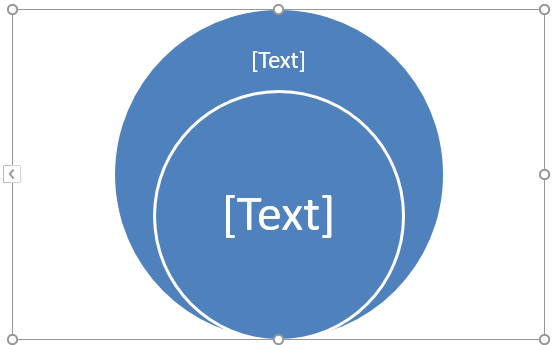
A is a subset of B, so if B represents the outer circle, A will represent the inner circle. Also, since all the elements of A are also present in B, we can reposition the inner circle by dragging it.
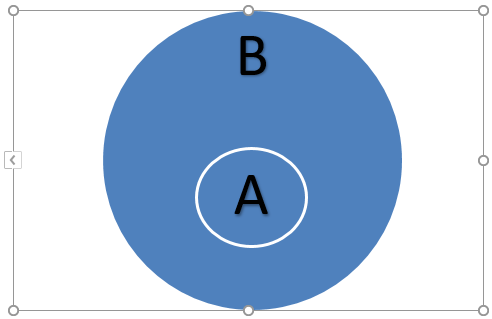
In this case, A U B will equal B as A is a subset of B. Also, A U B will be equal to A.
Things to Remember About Venn Diagram in Excel
- Venn diagrams illustrate simple set relationships. People use them in probability, statistics, computer science, and physics.
- Venn diagrams use overlapping circles to show the similarities, differences, and relationships between different groups of objects. The overlapping portions represent the similarities between groups, and the non-overlapping portions represent the differences.
- Venn diagrams enable us to organize information visually to see relationships between two or more sets of items. One can also create Venn diagrams using drawing tools available in Excel.
- We can even apply a SmartArtStyle to the Venn diagram. To do this, click on the ‘Design’ tab in the “SmartArt Tools and then click on the desired layout.
- We can even apply color combinations to the circles in the Venn diagram and change their colors as desired. Also, we can add soft edges, glows, and 3D effects. To do this, click on the ‘Design’ tab in the “SmartArt Tools and then click on ‘Change Colors’ and select the desired color theme:
Recommended Articles
This is a guide to Venn Diagram in Excel. We discuss creating Venn Diagrams in Excel, practical examples, and a downloadable Excel template here. You can also go through our other suggested articles –
