
What is S CURVE in Excel?
The S curve in Excel is a graphical report that shows the increasing progress of a project over time. It is a measure of productivity, meaning it helps you track your project’s progress on a daily or monthly basis.
It is called the “S curve” because the graph or chart resembles the shape of the letter “S.” Creating the S curve in Excel involves making a scatter plot, line chart, or other appropriate chart type. It is helpful for real-estate builders & developers to track & implement different phases of the project in their ongoing building project, which will help finish the ongoing project within the scheduled time & the allocated budget. It is also useful to track the project timeline and its costs in the I.T. & pharma companies.
How to Create S CURVE in Excel?
Let’s look at a few examples of how to work on S CURVE in Excel.
Example #1: S Curve for Profit Growth
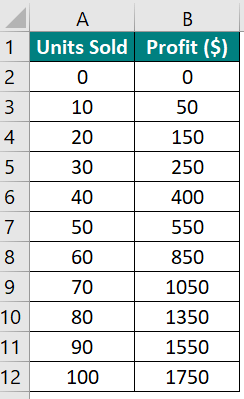
In this example, let us analyze the relationship between the number of units sold and the profit generated. We will create an S-curve graph in Excel to visualize how profit will likely evolve as the number of units sold increases.
Given:
Solution:
Step 1: Select data A2:B12.
Step 2: Go to Insert Tab, select All Charts from Recommended Charts, and Choose Stacked Line from Line Chart.
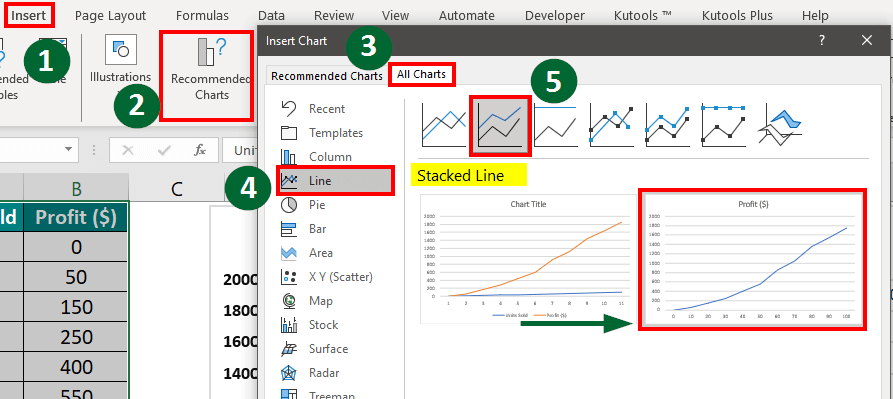
Step 3: Format the graph as per your requirement
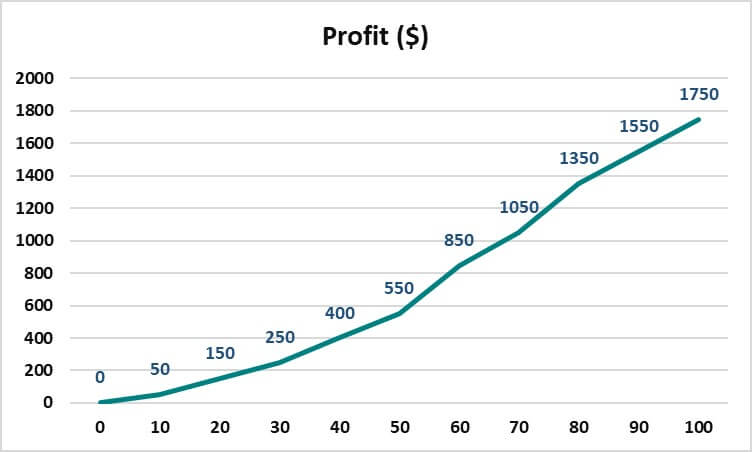
Result:
The S-curve graph in this example shows that when you sell more products, your profit increases, speeds up in the middle (between 40 and 80 units), and stabilizes.
Example #2: S Curve for Popularity of Smartphone App
Let us track the popularity of a new smartphone app over 2 years by creating an S-curve in Excel.
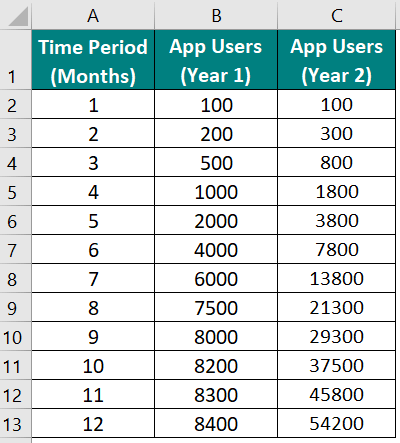
Given:
Solution:
Step 1: Select data A2:C13
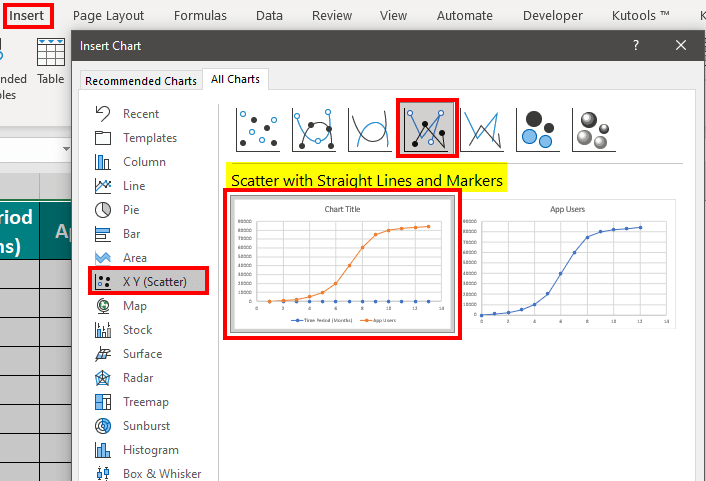
Step 2: Go to Insert Tab, select All Charts from Recommended Charts, and Choose Scatter Chart.
Step 3: Format the graph as per the requirement.

Both S curves show the typical pattern where smartphone users start with a lower number for a certain period (till 4th month). Soon it shows a rapid growth between the 5th and 8th month. From the 9th to the 12th month, it finally shows a stable user base.
Example #3: S Curve for a Building Project
We have a list of tasks for a building project and an amount allocated for each task. We need to create an S curve to show the percentage of work completed each week of the project.
Given:
| BUILDING PROJECT TASK | AMOUNT |
| Grading, Foundation & Framing | $7,500,000 |
| Roofing, Windows & Doors Installation | $3,000,000 |
| Electrical & Plumbing Work | $2,000,000 |
| Architectural Work | $1,200,000 |
| Site Utilities | $1,000,000 |
| Fire Suppression System | $1,500,000 |
| Final Inspection and Quality Assurance | $1,000,000 |
Solution:
Here’s a step-by-step guide to how to create the S-curve in Excel.
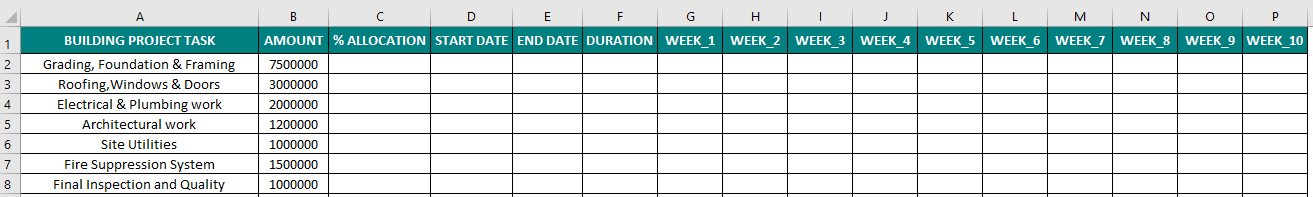
Step 1: Enter Data in Excel
First, you need to have your project data in an Excel spreadsheet. Add the following columns:
- Column A: Task list.
- Column B: The budget allocated for each task.
- Column C: The percentage of budget allocated for each task.
- Column D: The starting week for each task.
- Column E: The ending week for each task.
- Column F: The duration of each task in weeks.
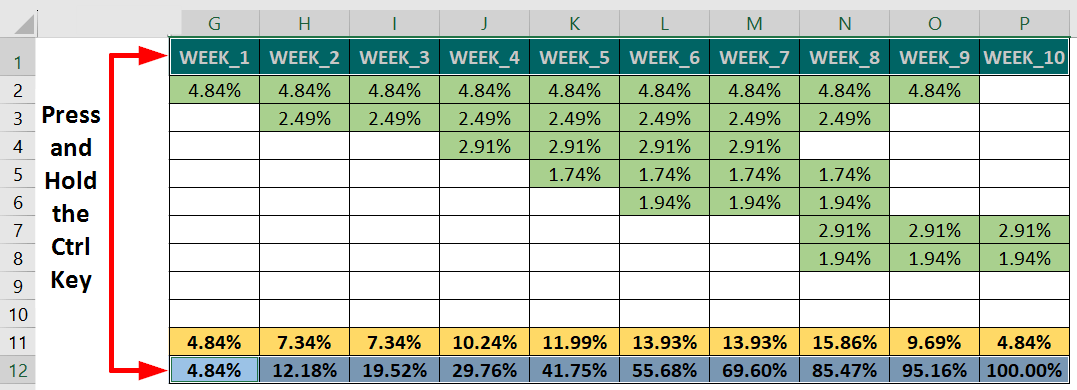
- Column G to P: Each week’s progress % from Week_1 to Week_10.
It will look like this:
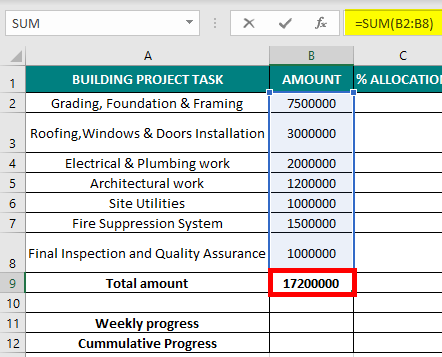
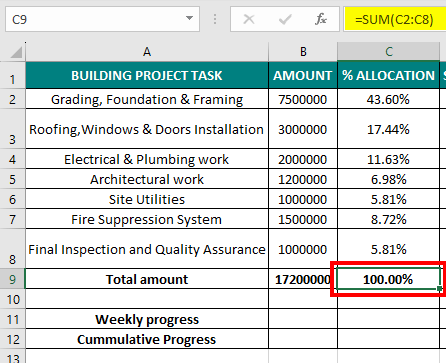
Step 2: The next step is to calculate the total amount of each task by applying the sum formula. i.e. =SUM(B2:B8)
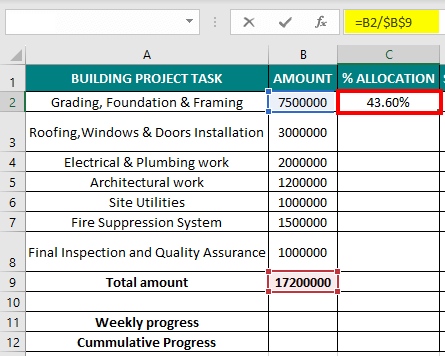
Step 3: Calculate the % Allocation
Then, we will calculate the percentage allocation for each task using the following formula:
% Allocation = (Task Amount / Total Project Amount)
For the first task, we will use this formula:
=B2/$B$9
=43.60%
Drag the formula till cell C8 to find the % Allocation for each task. Then, we also calculate the Total percentage by using the SUM Formula.
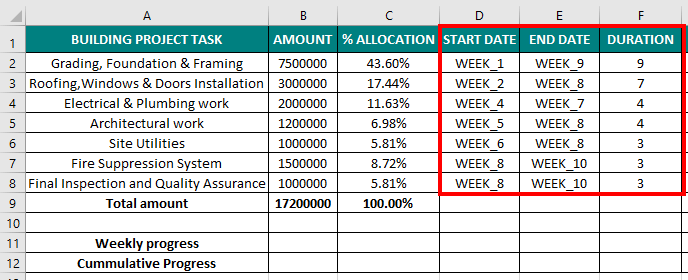
Step 4: Add the start and end weeks and their duration in columns D, E & F.
Step 5: Calculate the allocation percentage for each specific week (e.g., Week 1) using the formula below,
Week_1 allocation % = % Allocation for task / Duration of weeks
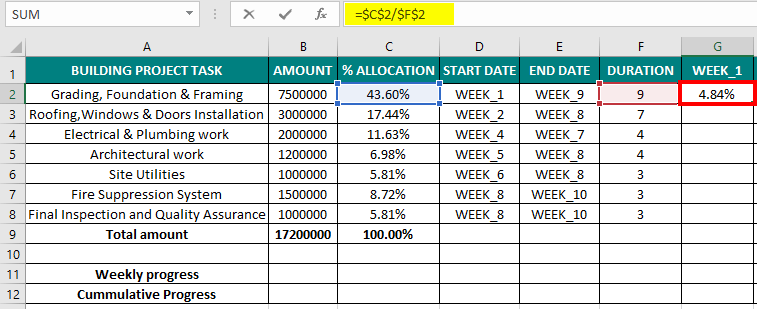
Calculate the same for Weeks 2, 3, till 10 for all tasks.
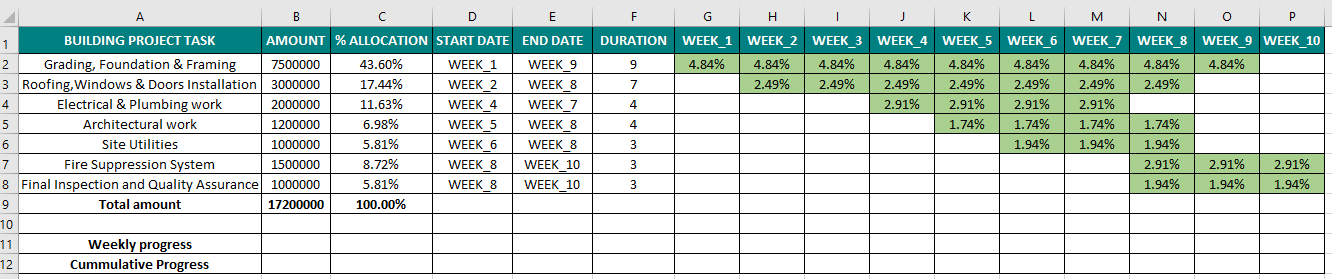
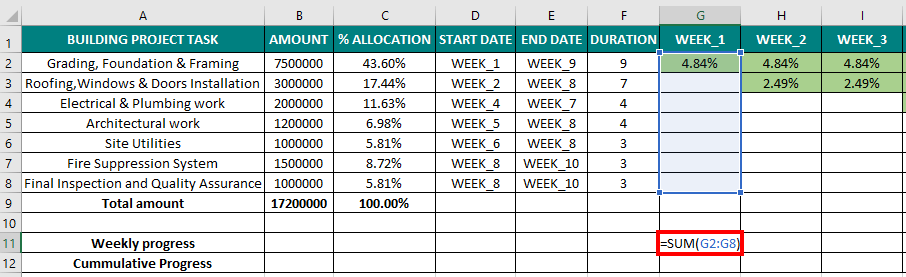
Step 7: Calculate the weekly progress by using the SUM Formula.
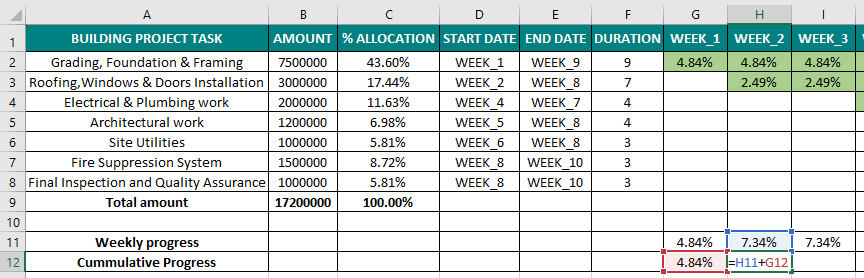
Step 8: Calculate the Cumulative progress by using the below formula,
=H11+G12.
Result:
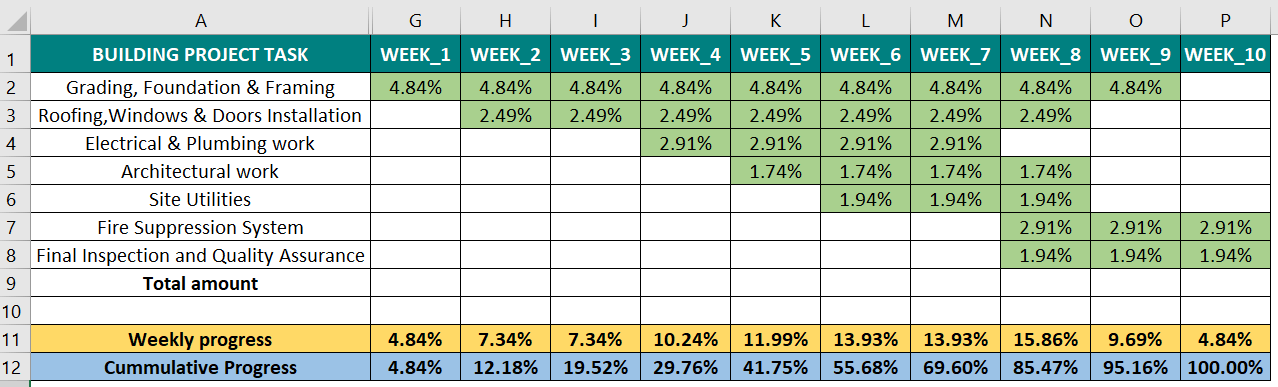
Step 9: Create the S Curve in Excel
Now, create the S-curve graph using the cumulative progress data.
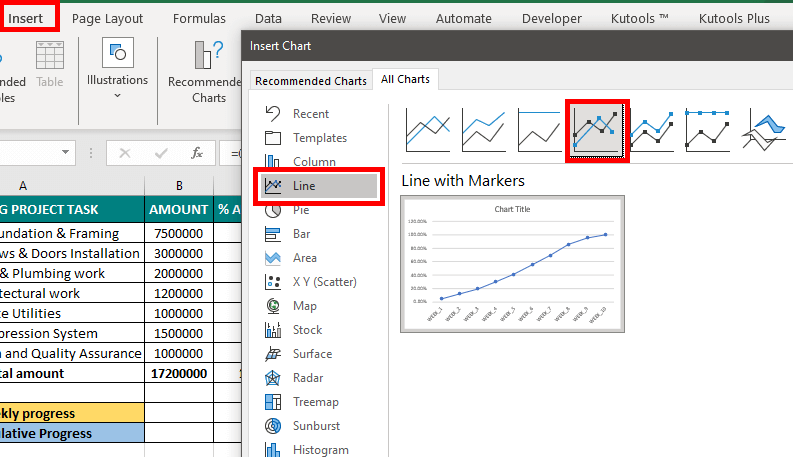
1. Select row 1 (Week_1 to Week_10), hold the Ctrl key and then select row 12 (Cumulative Progress range).
2. Go to the Insert tab and choose a line or scatter chart (whichever you prefer).
Result:
Finally, you can view the S-curve for your project. Now, you can format your chart as per your requirements. We have added data labels for each percentage, added a red color to the data points, and added a green color to the curve.
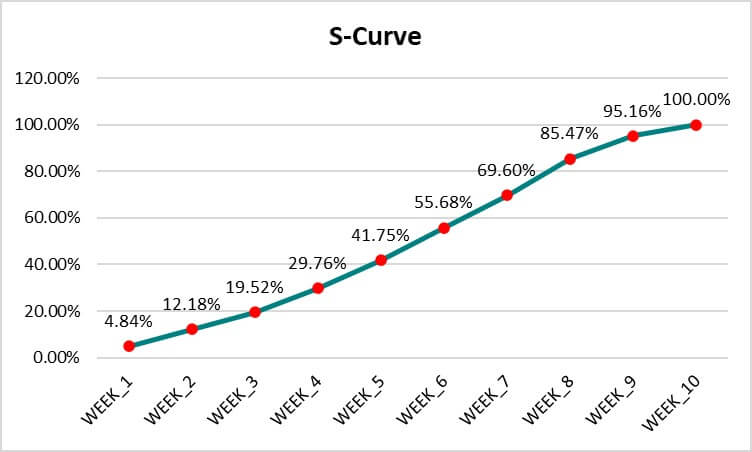
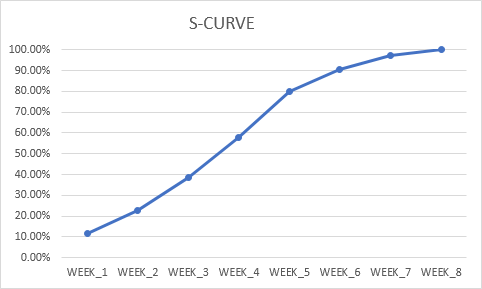
In the above S curve we can see the project progresses at a constant and slow rate in the first 3 weeks. After that, the project picks up speed between Week_4 and Week_8. Finally, the project growth once again slows down from Week_8 to Week_10.
Uses of S CURVE in Excel
- S-curve in Excel displays the phases of a product’s life, from introduction to decline.
- It helps monitor project progress, comparing planned vs. actual performance.
- S-curve compares planned costs to actual costs in project management.
- It tracks resource usage over time to ensure efficient allocation.
- It can also help predict future revenue growth in business.
- It monitors defect rates and process efficiency.
- It visualizes investment portfolio growth or financial product adoption.
Recommended Articles
We hope this guide on S CURVE in Excel, discussing how to create an S curve in Excel, was useful to you. You may also look at the following articles to learn more:
