Updated June 5, 2023
Variance Formula (Table of Contents)
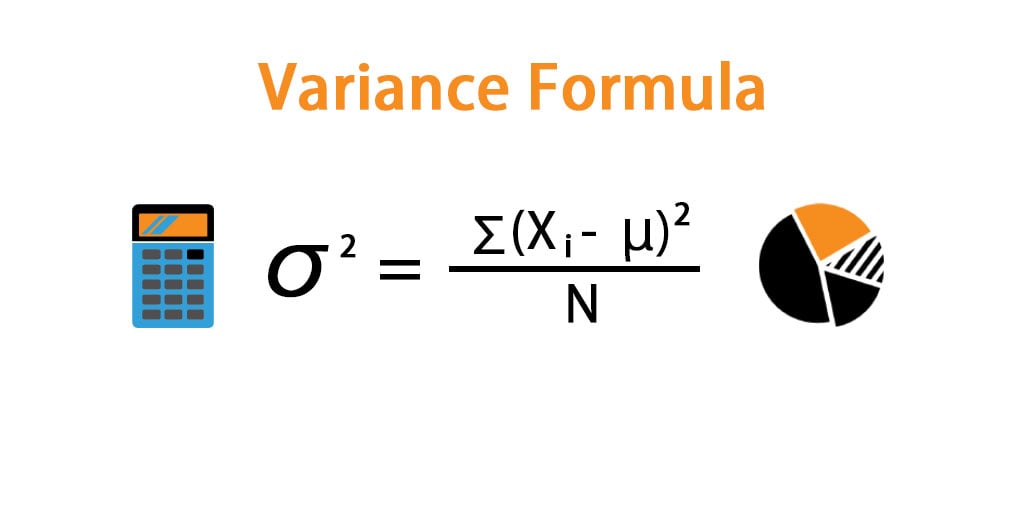
What is a Variance Formula?
The term “variance” refers to the dispersion of the data points of a data set from its mean, computed as the average of the squared deviation of each data point from the Population means. You can derive the formula for Variance by summing up the squared deviation of each data point and then dividing the result by the total number of data points in the data set. Mathematically, it is represented as,
σ2 = ∑ (Xi – μ)2 / N
where,
- Xi = ith data point in the data set
- μ = Population mean
- N = number of data points in the Population
Examples of Variance Formula (With Excel Template)
Let’s take an example to understand the calculation of the Variance in a better manner.
Variance Formula – Example #1
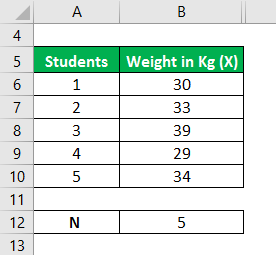
Let us take the example of a classroom with 5 students. The class had a medical check-up wherein they were weighed, and the following data was captured. Calculate the Variance of the data set based on the given information.
Solution:
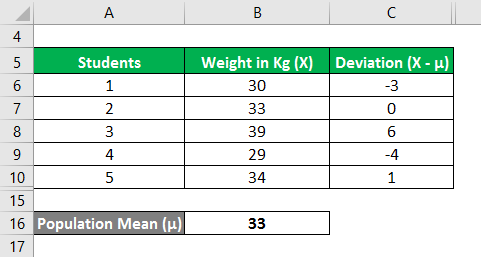
The population Mean is calculated as follows:
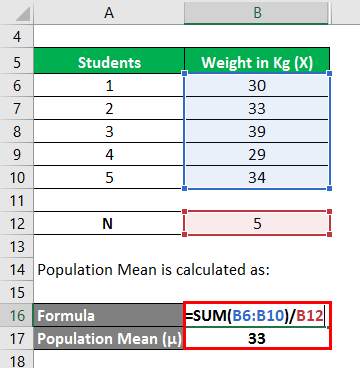
- Population Mean = (30 kgs + 33 kgs + 39 kgs + 29 kgs + 34 kgs) / 5
- Population Mean = 33 kgs
We need to calculate the deviation, i.e., the difference between the data points and the mean value.
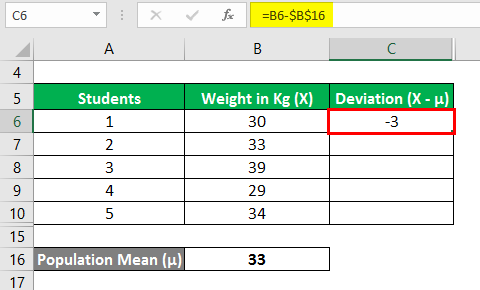
Similarly, calculate all values of the data set.
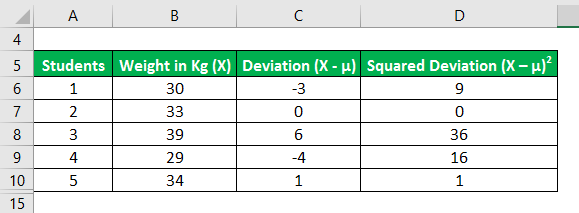
Now, let us calculate the squared deviations of each data point as shown below,
Variance is calculated using the formula given below
σ2 = ∑ (Xi – μ)2 / N
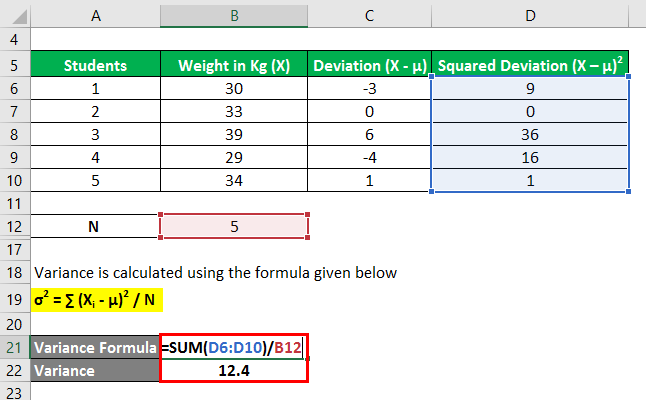
- σ2 = (9 + 0 + 36 + 16 + 1) / 5
- σ2 = 12.4
Therefore, the Variance of the data set is 12.4.
Variance Formula – Example #2
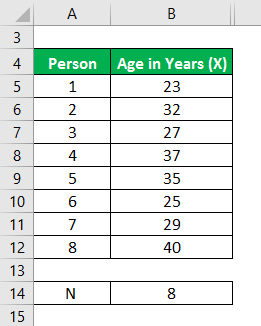
Let us take the example of a start-up company that comprises eight people. The age of all the members is given. Calculate the Variance of the data set based on the provided information.
Solution:
The population Mean is calculated as follows:
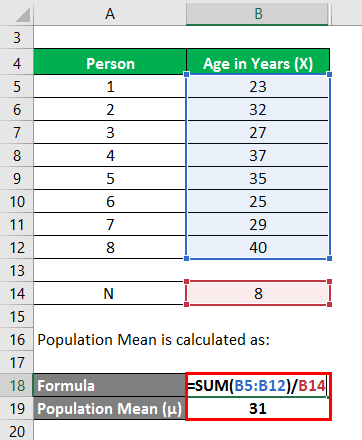
- Population Mean = (23 years + 32 years + 27 years + 37 years + 35 years + 25 years + 29 years + 40 years) / 8
- Population Mean = 31 years
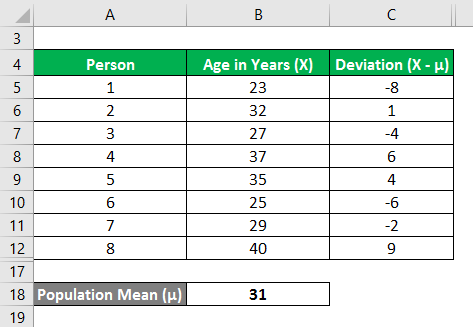
Now, we need to calculate the deviation, i.e., the difference between the data points and the mean value.
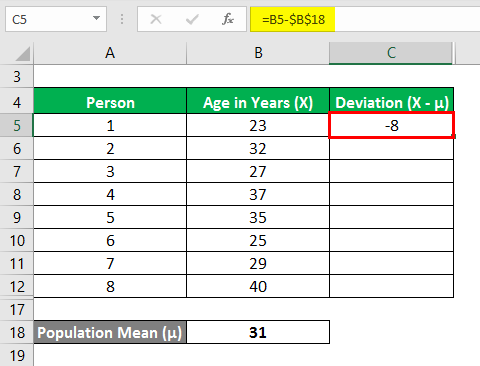
Similarly, calculate all values of the data set.
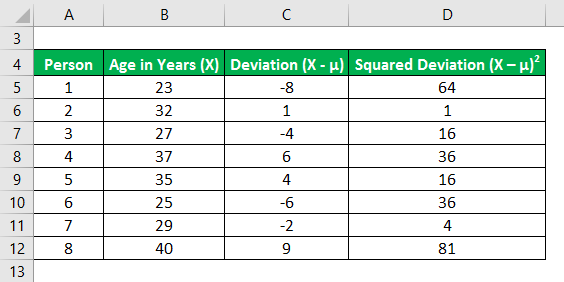
Now, let us calculate the squared deviations of each data point as shown below,
The formula for calculating Variance is as follows:
σ2 = ∑ (Xi – μ)2 / N
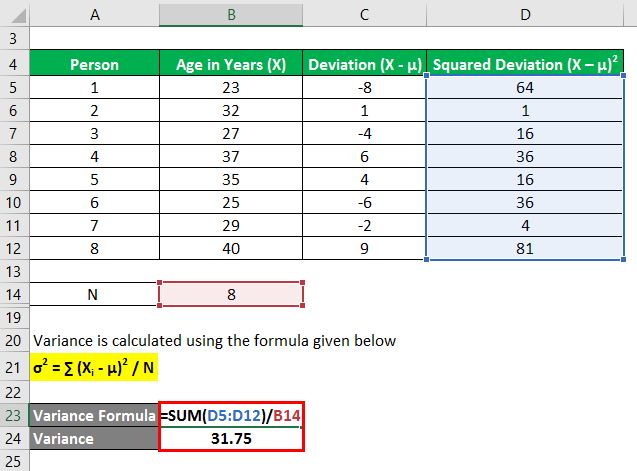
- σ2= (64 + 1 + 16 + 36 + 16 + 36 + 4 + 81) / 8
- σ2= 31.75
Therefore, the Variance of the data set is 31.75.
Explanation
The formula for a variance can be derived by using the following steps:
Step 1: Firstly, create a population comprising many data points. Xi will denote these data points.
Step 2: Next, calculate the number of data points in the Population denoted by N.
Step 3: Next, calculate the Population means by adding all the data points and dividing the result by the total number of data points (step 2) in the Population. The Population means denoted by μ.
μ = X1 + X2 + X3 + X4 + X5 / N
or
μ = ∑ Xi / N
Step 4: Next, subtract the Population means from each of the data points of the Population to determine the deviation of each of the data points from the mean, i.e., (X1 – μ) is the deviation for the 1st data point, while (X2– μ) is for the 2nd data point, etc.
Step 5: Next, determine the square of all the deviations calculated in step 4, i.e. (Xi – μ)2.
Step 6: Next, sum up all of the respective squared deviations calculated in step 5, i.e. (X1 – μ)2 + (X2 – μ)2 + (X3 – μ)2 + …… + (Xn – μ)2 or ∑ (Xi – μ)2.
Step 7: To derive the formula for Variance, divide the sum of the squared deviations calculated in Step 6 by the total number of data points in the Population (Step 2), as shown below.
σ2 = ∑ (Xi – μ)2 / N
Relevance and Uses of Variance Formula
From a statistician’s perspective, Variance is an essential concept to understand. It is often used in probability distribution to measure the variability (volatility) of the data set vis-à-vis its mean. The volatility serves as a measure of risk, and as such, the Variance helps assess an investor’s portfolio risk. A zero variance signifies that all variables in the data set are identical. On the other hand, a higher variance can indicate that all the variables in the data set are far-off from the mean. In comparison, a lower variance signifies precisely the opposite. Please keep in mind that Variance can never be a negative number.
Recommended Articles
This is a guide to Variance Formula. Here we have discussed how to calculate the Variance along with practical examples and a downloadable Excel template. You may also look at the following articles to learn more –
