Updated September 20, 2023
What is the Quartile Formula?
The quartile formula divides a dataset into 4 equal halves to find the three median/quartile values. In simple terms, the quartile formula is an advanced version of the median formula. Similar to how the median gives us one middle value for a set of data by dividing the entire data into 2 equal parts, quartiles give us three middle values by dividing a set of data into four equal parts.
Quartiles are a useful statistical tool that helps statisticians study a set of data and understand the arrangement of data in a dataset. They usually use quartiles to plot graphs, compare datasets, find extreme values (outliers), and more.
Table of Contents
Let us understand the logic behind the quartile formulas and how to use them.
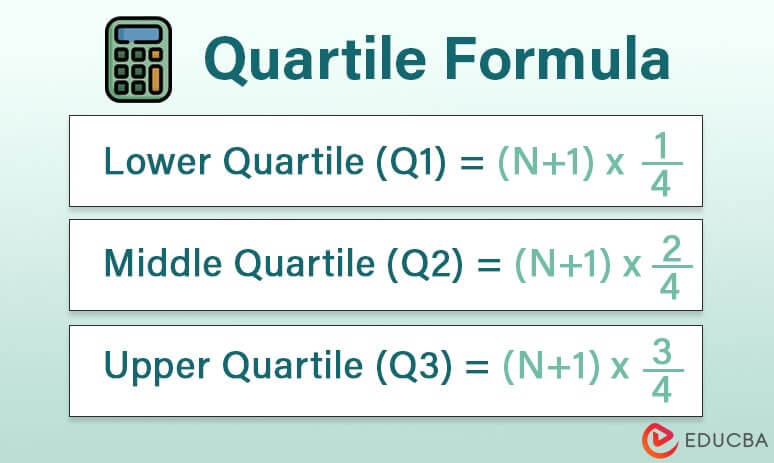
1. Lower Quartile (Q1) Formula
The lower or first quartile (Q1) divides the dataset into 2 parts, where the first part has all values that fall under the lower 25% of data, and the second part has all values that come under the upper 75% of the data.

For example, if the dataset = 1,2,3,4. The lower quartile will divide into two groups: the first group will contain only the number 1, and the second group will have the numbers 2, 3, and 4.
2. Middle Quartile (Q2) Formula
The second quartile (Q2) is the regular median that divides the dataset into 2 parts, where the first part has all values that fall under the lower 50% of data, and the second part has all values that come under the upper 50% of the data.

For example, if the dataset = 1,2,3,4. The middle quartile divides the data into two groups: the first will have data 1 & 2, and the second will have data 3 & 4.
3. Upper Quartile (Q3) Formula
The upper or third quartile (Q3) divides the dataset into 2 parts, where the first part has all values that fall under the lower 75% of data, and the second part has all values that come under the upper 25% of the data.

For example, if the dataset = 1,2,3,4. The upper quartile puts the data in two groups: the first will have data 1,2, & 3, and the second will have data 4.
Examples: Quartile Formula in Excel
Download the Excel template here:
Example #1: Odd Dataset
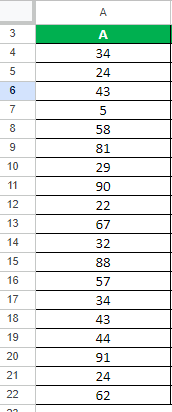
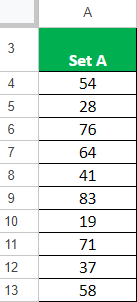
Let’s say we have a data set A which contains 19 data points. Let us find all the quartiles for this data set A.
Consider the following data:
Solution:
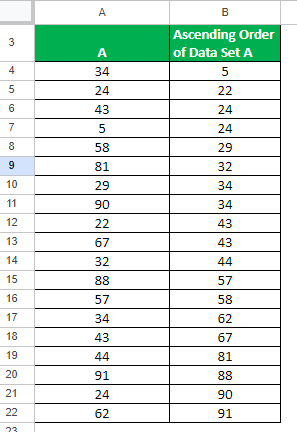
Step 1: Sort in Ascending Order
First, we must arrange this dataset from lowest to highest value.
There are multiple methods to sort data in Excel. You can choose any method.
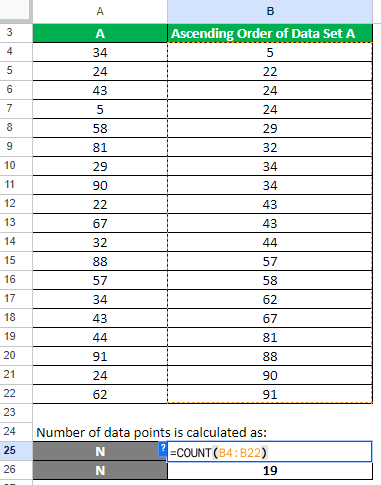
Step 2: Find N
We need to calculate the number of data points. For this, use the below Excel function:
=COUNT(B4:B22)
= 19
Step 3: Calculate Lower Quartile (Q1)
Let us use the following lower quartile formula to find Q1.
Lower Quartile (Q1) = (N+1)x1/4
= (19+1)x1/4
= 20/4
= 5th data point
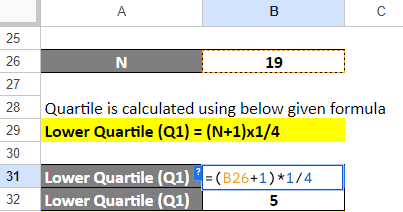
As the lower quartile is the value present in the 5th data point, our first quartile (Q1) is 29.
Step 4: Calculate Middle Quartile (Q2)
We will use the below formula to calculate Q2.
Middle Quartile (Q2) = (N+1)x2/4
= (19+1)x2/4
= 40/4
= 10th data point
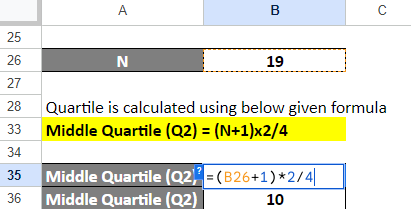
Since the 10th data point in our dataset is 43, it will be our middle Quartile (Q2) or median value.
Step 5: Calculate Upper Quartile (Q3)
Use the upper quartile formula to find the value for Q3.
Upper Quartile (Q3)= (N+1)x3/4
= (19+1)x3/4 = 60/4
= 15th data point
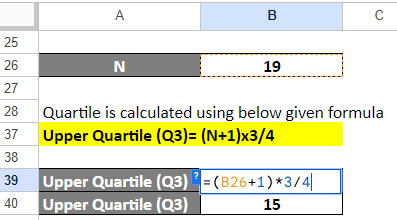
Here, in dataset A, the 15th value is the upper quartile, which means that the value for Q3 is 67.
Result:
- Lower Quartile (Q1) = 29
- Middle Quartile (Q2) = 43
- Upper Quartile (Q3) = 67
Example #2: Even Dataset
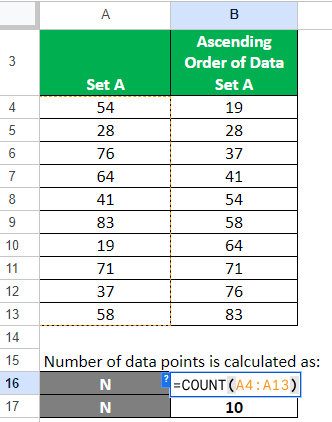
For this example, we will consider dataset A, which has 10 values. Let us calculate all the quartiles for it.
Given,
Solution:
When the dataset is even, we follow a different method than the usual quartile formula:
- First, find the median, i.e., the middle quartile (Q2) for the entire dataset.
- Then, divide the dataset into two equal groups.
- Now, find the median for the first group. It will be the lower quartile (Q1).
- Finally, find the median for the second group. It will be the upper quartile (Q3).
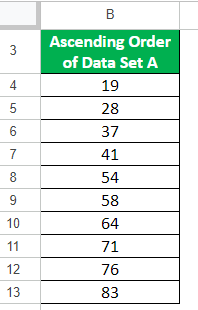
Step 1: Sort the Data
First, use any Excel method to sort the data in ascending order.
Step 2: Find N
Use the Count() Function in Excel to calculate the total number of values present in the dataset.
Step 3: Calculate Middle Quartile (Q2)
When we find quartiles for an even dataset, we must first find the median. Thus, first, use the formula below to find the middle quartile’s position.
Middle Quartile (Q2) =N/2 & (N+1)/2
=10/2 & (10+1)/2 = 5th and 6th position.
When we get two terms for a single quartile, we take the average of both values to find the quartile value. Here the value present at the 5th and 6th position is 54 and 58, respectively.
So, the median will be,
Q2 = (54+58)/2 = 56
Step 4: Split the Dataset
After finding the middle quartile, we need to split the dataset into 2 halves.
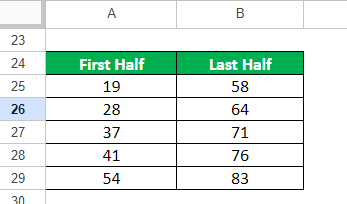
Step 5: Calculate Lower Quartile (Q1)
For finding the lower quartile, we use the median formula for an odd dataset as our N is now odd.
Lower Quartile (Q1) = (N+1)2 = (5+1)/2 = 3
The lower quartile is the 3rd term of the first half of the dataset, so Q1 is 37.
Step 6: Calculate Upper Quartile (Q3)
Use the following median formula to find the position for the upper quartile.
Upper Quartile (Q3) = (N+1)2 = (5+1)/2 = 3
The upper quartile is the 3rd term of the second half of the dataset, so Q3 is 71.
Result:
- Lower Quartile (Q1) = 37
- Middle Quartile (Q2) = 56
- Upper Quartile (Q3) = 71
What is Interquartile Range?
The interquartile range (IQR) is a way to find the range that the middle 50% of values fall into. It basically helps us find what is the gap between the smallest and the largest value from the middle 50% of the dataset.
The interquartile range formula is,
Example:
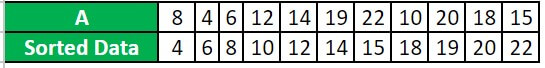
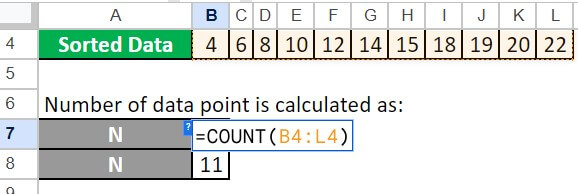
Suppose you have the following set of numbers: 8, 4, 6, 12, 14, 19, 22, 10, 20, 18, 15.
Find what is the interquartile range for the above dataset.
Given,
![]()
Solution:
Step 1: First, we arrange them in ascending order.
Step 2: Now, we will find the N for the given dataset
=COUNT(B3:B13) = 11
Step 3: Now, we have to find Q1 and Q3.
- Lower Quartile (Q1) = (N+1) x 1/4
= (11+1) x 1/4 = 12/4
= 3rd data point
As the value present in the 3rd position of the dataset is 8, the lower quartile will be 8.
- Upper Quartile (Q3)= (N+1) x 3/4
= (11+1) x 3/4 = 36/4
= 9th data point
Since the upper quartile’s value is present in the 9th position, the upper quartile is 19.
Step 4: Now, we calculate the interquartile range (IQR).
IQR = Q3-Q1
= 19-8
= 11
Since the IQR is 11, it tells us that the middle 50% of values in the dataset fall within a range of 8 to 19. This means that the values within this range are not very diverse or spread out. In contrast, if the IQR were higher, it would indicate that the values in the middle of the dataset vary significantly from each other.
Uses of Quartiles
1. Finding Outliers: Quartiles can help us spot values that are very different from the rest of the data. These are called outliers. For example, in the following data range – 1, 2, 1.5, 2.2, 7, 2.9 – 7 will be the outlier.
We can use the interquartile rule to find outliers for large datasets with hundreds of values. It sets a maximum value that the dataset can have; if any value is higher than that, it is an outlier.
2. Understanding Data Spread: Quartiles help us see the distribution and concentration of the data.
3. Comparing Data Sets: We can use quartiles to compare different data sets and see how similar or different they are from each other.
4. Statistical Analysis: Quartiles help us find a particular range of dataset and other statistical measures, like the median.
Frequently Asked Questions (FAQs)
Q1. What is quartile, decile, percentile formula?
Answer: The Quartile, Decile, and Percentile formulas divide a data set into equal or specific parts.
- Quartiles: They equally divide the set of data into 4 parts, and we get 3 quartiles: Q1, Q2, and Q3.
- Deciles: They equally separate the set of data into 10 parts, and we get 9 deciles: D1, D2, D3, …, and D9.
- Percentiles: They equally split the set of data into 100 parts, and we get 99 percentiles: P1, P2, P3, …, and P99).
Q2. What is the formula of quartile for grouped data?
Answer: When we have a dataset where the information is present in pairs, and one of the pairs has data with intervals (range in between), we use the quartile formula for grouped data.
For example, the data for the height and its optimal associated weight would look something like this:
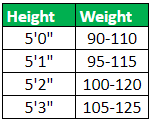
Here we have a pair of data, and one of the data pairs (weights) has an interval. Thus, to calculate quartiles for grouped data, we can use the following formula:
In this formula:
- Qi represents the quartile value we are trying to find.
- N is the total frequency of the data.
- h represents the class size which refers to the width or range of each group or interval.
- L represents the lower limit of the class of the quartile value.
- f represents the frequency of the class of the quartile value.
- f represents the cumulative frequency of the quartile value.
Q3. What is the quartile deviation formula in statistics?
Answer: The Quartile Deviation (Q.D) formula helps assess whether the values close to the median (middle quartile) are significantly closer or farther away from it. For instance, if the median is 5 and the surrounding values are 4, 4.5, 5.6, and 5.1, then there is less dispersion. On the other hand, if the values are 1, 2, 7, and 6, then there is more dispersion.
A lower value of Q.D means there is less dispersion, and vice versa.
Recommended Articles
This article shows how to calculate a quartile using the Quartile Formula in Excel. It provides examples and an Excel template that you can download. You can also explore related topics listed below:
