Updated May 31, 2023
Sample Size Formula (Table of Contents)
- Sample Size Formula
- Examples of Sample Size Formula
- Sample Size Formula in Excel (With Excel Template)
Sample Size Formula
The sample size is the most important term used in statistics. It is a part or percentage you choose from a population for a survey, experiment, or opinions or behavior you are concerned about. Choosing the most appropriate sample size is essential because a very small sample size will give you only inappropriate results and a larger sample size wastes time, money, resources, etc. And when you have a larger or smaller population, on which basis can one carry out the survey? For this, the survey is done for a set of random samples. Cochran’s formula is the most appropriate formula for finding the sample size manually. The desired precision level and population size should be known to use this formula.
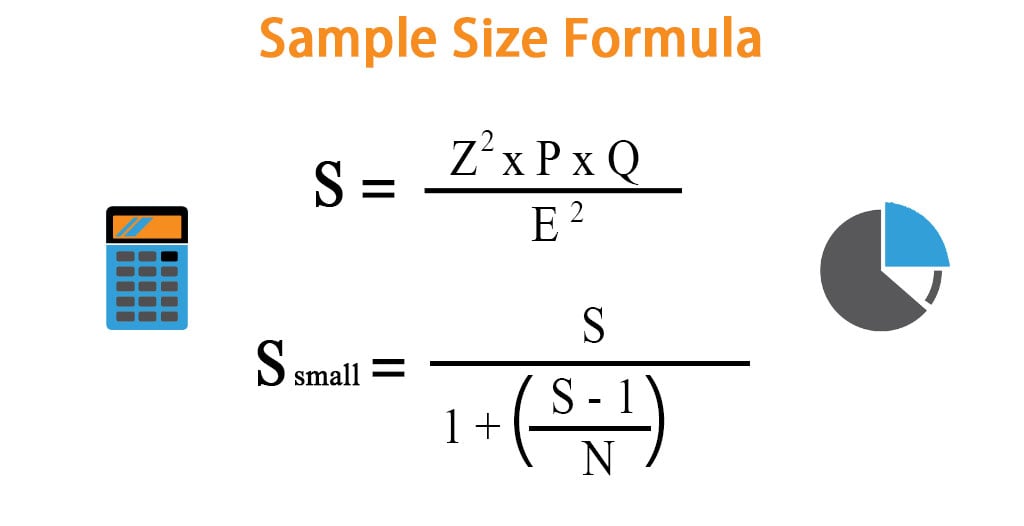
The formula for the sample size can be written mathematically as follows:
- One can use the following formula when you want to identify the sample size for a larger population.
- When you want to identify the sample size for a smaller population, the above formula can be modified like the one below.
Examples of Sample Size Formula
Let’s take an example to understand the calculation of Sample Size in a better manner.
Sample Size Formula – Example #1
Assume the GRE score is out for a Brand X coaching center for 1000 students. The Score achieved is 3002, and the mean is found to be 1480. It has a standard deviation of 480. You expect the Margin of Error to be 80%. The proportion is set to be 0.8. Calculate Sample Size using the information:
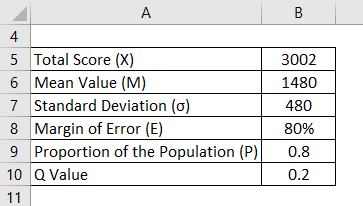
Solution:
Z – Score is calculated using the formula given below
Z = (X – M) / σ
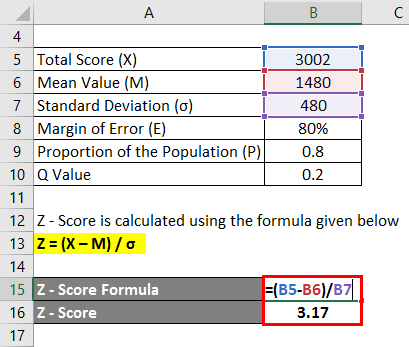
- Z – Score = (3002 – 1480) / 480
- Z – Score = 3.17
The sample size is calculated using the formula given below
S = (Z2 * P * Q) / E2
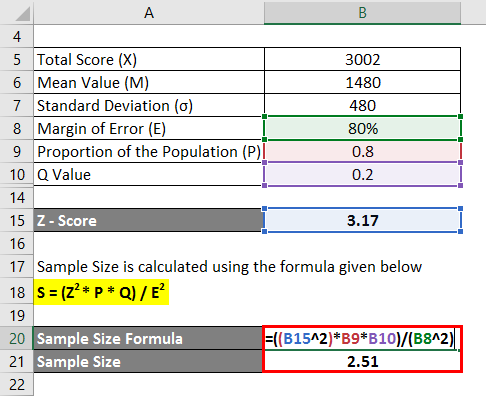
- Sample Size = (3.172 * 0.8 * 0.2) / (80%)2
- Sample Size = 2.51
For this data set, the appropriate Sample size is 2.51
Sample Size Formula – Example #2
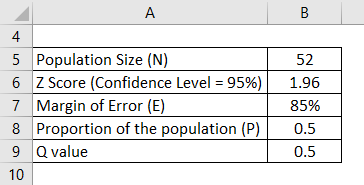
Assume a hill station X has a total number of 52 hotels. We need to find how many hotels provide breakfast in X. Half of the hotels may render breakfast service for the customers; hence let us take P as 0.5. The Confidence level is 95%, and the Margin of Error also consider as 85%. Calculate Sample Size using the information:
Assuming this is the normal distribution, let us find the Z value from the Z table. For 95 % of the confidence value, the Z value will be 1.96 per the normal table. Z = 1.96.
Solution:
For Large Population
The sample size is calculated using the formula given below
S = (Z2 * P * Q) / E2
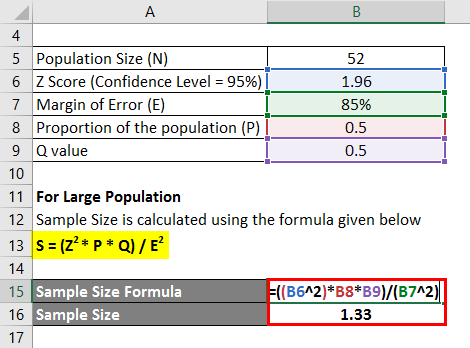
- Sample Size =(1.962 * 0.5 * 0.5) / (85%)2
- Sample Size = 1.33
For Small Population
The sample size is calculated using the formula given below
Ssmall = S / (1 + ((S – 1) / N))
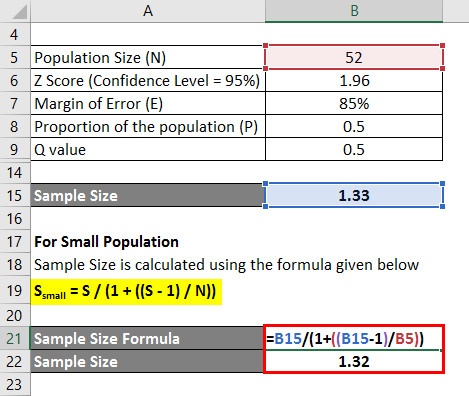
- Sample Size = 1.33 / (1 + ((1.33 – 1) / 52))
- Sample Size = 1.32
For this data set, the appropriate Sample size is 1.32
Explanation
Step 1: Note down the value. Z value can be called a Z score or Standard Score value. It is the number of the standard deviation a mean data point of a population has. That is, say you have a particular population size, which has some mean, a data point. So Z score is the total number of standard deviations it has before and after that mean data point. Generally, you can note this value from the Z table. The Z score has some basic formula too.
Z = (X – M) / σ
X is the population’s total number, M is the population’s mean, and σ is the standard deviation. Assume you have a normally distributed data set of 80, and the mean of the data set is 50 and a standard deviation of 15. Now,
Z = (80- 50)/15 = 2.
This Z score tells you the number of standard deviations your data set has above from the mean data point. Here it has 2 standard deviations above its mean.
Step 2: Note down the value of P. P is nothing but the proportion of the population.
Step 3: Note the value of E. E is the Margin of Error, which is a % value that tells how much you can wait for your results to reflect the end results or opinions from the overall population. The smaller the E value, the appropriate Sample size one can yield out of this formula.
Step 4: Find out the value of Q. Q = 1 – P.
Step 5: Finally, note down the value of N. This is the overall population size or the number of people on what you want to do your research.
Step 6: If you have a larger population, you can apply the noted values in the given formula.
S = (Z2 * P * Q) / E2
Step 7: If you have a smaller population, you can apply the noted values in the formula below. Ssmall is simply the sample size for the small Size of the population.
Ssmall = S / (1 + ((S – 1) / N))
Relevance and Use of Sample Size Formula
Any business field you take, how it goes on live and how much response it gets from the customers, and how good or bad it is compared to the other similar things in the market, everything should be estimated often to improve the performance of any business and to increase its capital and revenue. In that case, when one wants to perform any surveys or research, not the whole amount of data can be tested. For example, a survey for millions of people at a time is time-consuming and money wastage. Taking 1 out of millions will not yield correct results, leading to negative results, which is a Type II error. Hence, we will carry out the survey for a chosen percentage of the whole population. We will take this part of the population as a random sample.
Sample Size Formula Calculator
You can use the following Sample Size Calculator
| Z | |
| P | |
| Q | |
| E | |
| S | |
| S | = |
|
|
Sample Size Formula in Excel (With Excel Template)
Here we will give an example of the Sample Size Formula. It is very easy and simple.
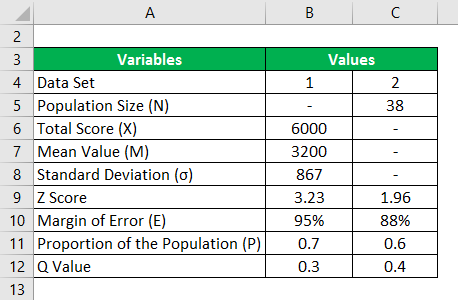
Below are the two different sets of data. Calculate the sample size using the below information.
In the Excel template, for 2 different sets of data, we have found the sample size. For the first set, we manually found the Z value because we have the total value, mean value, and standard deviation. For the second set, a direct Z score is provided for 85 % of the confidence level. Since the total population size is small, we also find a small Ssmall for the appropriate sample size value.
For Large Population
We calculate the sample size using the formula below
S = (Z2 * P * Q) / E2
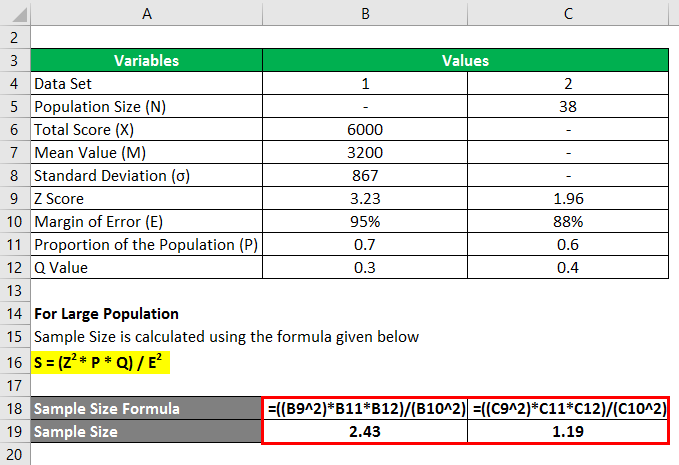
For Set 1
- Sample Size = (3.232 * 0.7 * 0.3) / (95%)2
- Sample Size = 2.43
For Set 2
- Sample Size = (1.962 * 0.6 * 0.4) / (88%)2
- Sample Size = 1.19
For Small Population
We calculate the sample size using the formula given below
Ssmall = S / (1 + ((S – 1) / N))
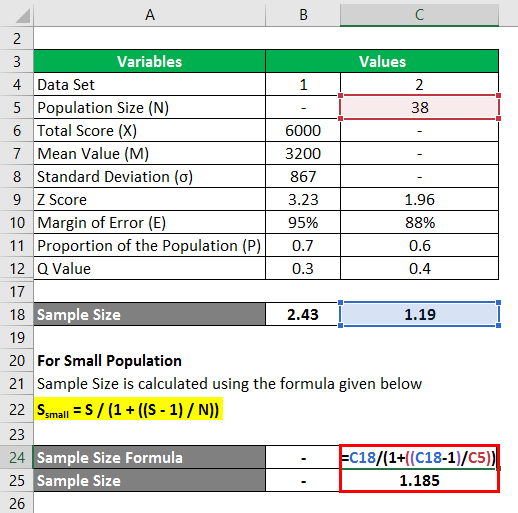
For Set 2
- Sample Size = 1.19 / (1 + ((1.19 – 1) / 38))
- Sample Size = 1.185
Recommended Articles
This has been a guide to Sample Size Formula. Here we discuss how to calculate Sample Size along with practical examples. We also provide a Sample Size calculator with a downloadable Excel template. You may also look at the following articles to learn more –
