EDUCBA

EDUCBA

MENUMENU
  • Free Tutorials
  • Free Courses
  • Certification Courses
  • 360+ Courses All in One Bundle
  • Login
Home Data Science Data Science Tutorials Head to Head Differences Tutorial Qlik Sense vs Tableau
Secondary Sidebar
Head to Head Differences Tutorial
  • Differences Tutorial
    • Scikit Learn vs TensorFlow
    • Azure Functions vs Logic Apps
    • Azure Data Factory vs Databricks
    • SHA1 vs MD5
    • Azure SQL Database vs Managed Instance
    • Azure SQL Database vs SQL Server
    • PostgreSQL vs MySQL
    • PostgreSQL vs MySQL Benchmark
    • ArangoDB vs MongoDB
    • Cloud Computing vs Big Data Analytics
    • T-SQL vs SQL
    • PostgreSQL vs MariaDB
    • Spark vs Impala
    • Datadog vs Splunk
    • Domo vs Tableau
    • Data Scientist vs Data Engineer vs Statistician
    • Big Data Vs Machine Learning
    • Predictive Analytics vs Business Intelligence
    • AI vs Machine Learning vs Deep Learning
    • Business Intelligence vs Data Warehouse
    • Apache Kafka vs Flume
    • Data Science vs Machine Learning
    • Business Analytics Vs Predictive Analytics
    • Data mining vs Web mining
    • Data Science Vs Data Mining
    • Data Science Vs Business Analytics
    • Analyst vs Associate
    • Apache Hive vs Apache Spark SQL
    • Apache Nifi vs Apache Spark
    • Apache Spark vs Apache Flink
    • Apache Storm vs Kafka
    • Artificial Intelligence vs Business Intelligence
    • Artificial Intelligence vs Human Intelligence
    • Al vs ML vs Deep Learning
    • SQL vs SQLite
    • Assembly Language vs Machine Language
    • AWS vs AZURE
    • AWS vs Azure vs Google Cloud
    • Big Data vs Data Mining
    • Big Data vs Data Science
    • Big Data vs Data Warehouse
    • Blu-Ray vs DVD
    • Business Intelligence vs Big Data
    • Business Intelligence vs Business Analytics
    • Business Intelligence vs Data analytics
    • Business Intelligence VS Data Mining
    • Business Intelligence vs Machine Learning
    • Business Process Re-Engineering vs CI
    • Cassandra vs Elasticsearch
    • Cassandra vs Redis
    • Cloud Computing Public vs Private
    • Cloud Computing vs Fog Computing
    • Cloud Computing vs Grid Computing
    • Cloud Computing vs Hadoop
    • Computer Network vs Data Communication
    • Computer Science vs Data Science
    • Computer Scientist vs Data Scientist
    • Customer Analytics vs Web Analytics
    • Data Analyst vs Data Scientist
    • Data Analytics vs Business Analytics
    • Data Analytics vs Data Analysis
    • Data Analytics Vs Predictive Analytics
    • Data Lake vs Data Warehouse
    • Data Mining Vs Data Visualization
    • Data mining vs Machine learning
    • Data Mining Vs Statistics
    • Data Mining vs Text Mining
    • Data Science vs Artificial Intelligence
    • Data science vs Business intelligence
    • Data Science Vs Data Engineering
    • Data Science vs Data Visualization
    • Data Science vs Software Engineering
    • Data Scientist vs Big Data
    • Data Scientist vs Business Analyst
    • Data Scientist vs Data Engineer
    • Data Scientist vs Data Mining
    • Data Scientist vs Machine Learning
    • Data Scientist vs Software Engineer
    • Data visualisation vs Data analytics
    • Data vs Information
    • Data Warehouse vs Data Mart
    • Data Warehouse vs Database
    • Data Warehouse vs Hadoop
    • Data Warehousing VS Data Mining
    • DBMS vs RDBMS
    • Deep Learning vs Machine learning
    • Digital Analytics vs Digital Marketing
    • Digital Ocean vs AWS
    • DOS vs Windows
    • ETL vs ELT
    • Small Data Vs Big Data
    • Apache Hadoop vs Apache Storm
    • Hadoop vs HBase
    • Between Data Science vs Web Development
    • Hadoop vs MapReduce
    • Hadoop Vs SQL
    • Google Analytics vs Mixpanel
    • Google Analytics Vs Piwik
    • Google Cloud vs AWS
    • Hadoop vs Apache Spark
    • Hadoop vs Cassandra
    • Hadoop vs Elasticsearch
    • Hadoop vs Hive
    • Hadoop vs MongoDB
    • HADOOP vs RDBMS
    • Hadoop vs Spark
    • Hadoop vs Splunk
    • Hadoop vs SQL Performance
    • Hadoop vs Teradata
    • HBase vs HDFS
    • Hive VS HUE
    • Hive vs Impala
    • JDBC vs ODBC
    • Kafka vs Kinesis
    • Kafka vs Spark
    • Cloud Computing vs Data Analytics
    • Data Mining Vs Data Analysis
    • Data Science vs Statistics
    • Big Data Vs Predictive Analytics
    • MapReduce vs Yarn
    • Hadoop vs Redshift
    • Looker vs Tableau
    • Machine Learning vs Artificial Intelligence
    • Machine Learning vs Neural Network
    • Machine Learning vs Predictive Analytics
    • Machine Learning vs Predictive Modelling
    • Machine Learning vs Statistics
    • MariaDB vs MySQL
    • Mathematica vs Matlab
    • Matlab vs Octave
    • MATLAB vs R
    • MongoDB vs Cassandra
    • MongoDB vs DynamoDB
    • MongoDB vs HBase
    • MongoDB vs Oracle
    • MongoDB vs Postgres
    • MongoDB vs PostgreSQL
    • MongoDB vs SQL
    • MongoDB vs SQL server
    • MS SQL vs MYSQL
    • MySQL vs MongoDB
    • MySQL vs MySQLi
    • MySQL vs NoSQL
    • MySQL vs SQL Server
    • MySQL vs SQLite
    • Neural Networks vs Deep Learning
    • PIG vs MapReduce
    • Pig vs Spark
    • PL SQL vs SQL
    • Power BI Dashboard vs Report
    • Power BI vs Excel
    • Power BI vs QlikView
    • Power BI vs SSRS
    • Power BI vs Tableau
    • Power BI vs Tableau vs Qlik
    • PowerShell vs Bash
    • PowerShell vs CMD
    • PowerShell vs Command Prompt
    • PowerShell vs Python
    • Predictive Analysis vs Forecasting
    • Predictive Analytics vs Data Mining
    • Predictive Analytics vs Data Science
    • Predictive Analytics vs Descriptive Analytics
    • Predictive Analytics vs Statistics
    • Predictive Modeling vs Predictive Analytics
    • Private Cloud vs Public Cloud
    • Regression vs ANOVA
    • Regression vs Classification
    • ROLAP vs MOLAP
    • ROLAP vs MOLAP vs HOLAP
    • Spark SQL vs Presto
    • Splunk vs Elastic Search
    • Splunk vs Nagios
    • Splunk vs Spark
    • Splunk vs Tableau
    • Spring Cloud vs Spring Boot
    • Spring vs Hibernate
    • Spring vs Spring Boot
    • Spring vs Struts
    • SQL Server vs PostgreSQL
    • Sqoop vs Flume
    • Statistics vs Machine learning
    • Supervised Learning vs Deep Learning
    • Supervised Learning vs Reinforcement Learning
    • Supervised Learning vs Unsupervised Learning
    • Tableau vs Domo
    • Tableau vs Microstrategy
    • Tableau vs Power BI vs QlikView
    • Tableau vs QlikView
    • Tableau vs Spotfire
    • Talend Vs Informatica PowerCenter
    • Talend vs Mulesoft
    • Talend vs Pentaho
    • Talend vs SSIS
    • TensorFlow vs Caffe
    • Tensorflow vs Pytorch
    • TensorFlow vs Spark
    • TeraData vs Oracle
    • Text Mining vs Natural Language Processing
    • Text Mining vs Text Analytics
    • Cloud Computing vs Virtualization
    • Unit Test vs Integration Test?
    • Universal analytics vs Google Analytics
    • Visual Analytics vs Tableau
    • R vs Python
    • R vs SPSS
    • Star Schema vs Snowflake Schema
    • DDL vs DML
    • R vs R Squared
    • ActiveMQ vs Kafka
    • TDM vs FDM
    • Linear Regression vs Logistic Regression
    • Slf4j vs Log4j
    • Redis vs Kafka
    • Travis vs Jenkins
    • Fact Table vs Dimension Table
    • OLTP vs OLAP
    • Openstack vs Virtualization
    • Cluster v/s Factor analysis
    • Informatica vs Datastage
    • CCBA vs CBAP
    • SPSS vs EXCEL
    • Excel vs Tableau
    • Cassandra vs MySQL
    • RabbitMQ vs Kafka
    • SAAS vs Cloud
    • RabbitMQ vs Redis
    • AMQP vs MQTT
    • Forward Chaining vs Backward Chaining
    • Google Data Studio vs Tableau
    • ActiveMQ vs RabbitMQ
    • Cloud vs Data Center
    • Cores vs Threads
    • Inner Join vs Outer Join
    • ZeroMQ vs Kafka
    • Mxnet vs TensorFlow
    • Redis vs Memcached
    • RDBMS vs NoSQL
    • AWS Direct Connect vs VPN
    • Cassandra vs Couchbase
    • Elegoo vs Arduino
    • Redis vs MongoDB
    • Chef vs Puppet
    • GSM vs GPRS
    • Keras vs TensorFlow vs PyTorch
    • Cloudflare vs CloudFront
    • Bitmap vs Vector
    • Left Join vs Right Join
    • IaaS vs PaaS
    • Blue Prism vs UiPath
    • GNSS vs GPS
    • Cloudflare vs Akamai
    • GCP vs AWS vs Azure
    • Arduino Mega vs Uno
    • Qualitative vs Quantitative Data
    • Arduino Micro vs Nano
    • PIC vs Arduino
    • PRTG vs Solarwinds
    • PostgreSQL vs SQLite
    • Metabase vs Tableau
    • Arduino Leonardo vs Uno
    • Arduino Due vs Mega
    • ETL Vs Database Testing
    • DBMS vs File System
    • CouchDB vs MongoDB
    • Arduino Nano vs Mini
    • IaaS vs PaaS vs SaaS
    • On-premise vs off-premise
    • Couchbase vs CouchDB
    • Tableau Dimension vs Measure
    • Cognos vs Tableau
    • Data vs Metadata
    • RethinkDB vs MongoDB
    • Cloudera vs Snowflake
    • HBase vs Cassandra
    • Business Analytics vs Business Intelligence
    • R Programming vs Python
    • MongoDB vs Hadoop
    • MySQL vs Oracle
    • OData vs GraphQL
    • Soft Computing vs Hard Computing
    • Binary Tree vs Binary Search Tree
    • Datadog vs CloudWatch
    • B tree vs Binary tree
    • Cloudera vs Hortonworks
    • DevSecOps vs DevOps
    • PostgreSQL Varchar vs Text
    • PostgreSQL Database vs schema
    • MapReduce vs spark
    • Hypervisor vs Docker
    • SciLab vs Octave
    • DocumentDB vs DynamoDB
    • PostgreSQL union vs union all
    • OrientDB vs Neo4j
    • Data visualization vs Business Intelligence
    • QlikView vs Qlik Sense
    • Neo4j vs MongoDB
    • Postgres Schema vs Database
    • Mxnet vs Pytorch
    • Naive Bayes vs Logistic Regression
    • Random Forest vs Decision Tree
    • Random Forest vs XGBoost
    • DynamoDB vs Cassandra
    • Looker vs Power BI
    • PostgreSQL vs RedShift
    • Presto vs Hive
    • Random forest vs Gradient boosting
    • Gradient boosting vs AdaBoost
    • Amazon rds vs Redshift
    • Bigquery vs Bigtable
    • Data Architect vs Data Engineer
    • DataSet vs DataTable
    • dataset vs dataframe
    • Dataset vs Database
    • New Relic vs Splunk
    • Data Architect and Management Designer
    • Data Engineer vs Data Analyst
    • Grafana vs Tableau
    • MySQL text vs Varchar
    • Relational Database vs Flat File
    • Datadog vs Prometheus
    • Neo4j vs Neptune
    • Data Mining vs Data warehousing
    • DocumentDB vs MongoDB
    • PostScript vs PCL
    • QRadar vs Splunk
    • Qlik Sense vs Tableau
    • DigitalOcean vs Google Cloud
    • PostgreSQL vs Elasticsearch
    • Redshift vs blueshift
    • Gitlab vs Azure DevOps

Related Courses

Online Data Science Course

Online Tableau Training

Azure Training Course

Hadoop Certification Course

Data Visualization Courses

All in One Data Science Course

Qlik Sense vs Tableau

Qlik Sense vs Tableau

Difference between Qlik Sense vs Tableau

From the past years, Qlik Sense and Tableau have developed to a greater extent in visualization. Both enterprises analyzed that the tool integrated with ERP applications is in line, and they don’t want their employees to generate any report whenever any query data is required. Tableau stands as an outstanding one to give any self-service applications at ground level. And now both the organization have fixed their views on every level by enhancing the data volume to analyze it end to end. For example, the entire platform is re-constructed to develop a Qlik sense and surpasses the first Qlik sense to give the analytic application depends on the trending microservices, which is not programmed to process huge data and can be extensible as possible. The comparison and differences of Qlik Sense vs Tableau is explained briefly in this article.

Head to Head Comparison Between Qlik Sense vs Tableau (Infographics)

Below is the Top Comparison Between Qlik Sense vs Tableau:

Qlik-Sense-vs-Tableau-info

Key differences between Qlik sense vs tableau

Tableau is aimed to expand the data quantity and can be processed rapidly by fitting a hyperdata engine. In addition, the companies invest in speech recognition and artificial intelligence to make applications and processes more accessible. But one thing is fine: the end-user gains the advantage from consistent innovation without any strong competition and doesn’t come nearly and quickly.

Start Your Free Data Science Course

Hadoop, Data Science, Statistics & others

1. Price

Both Qlik and Tableau give a perpetual license for deployed software in a public cloud or on-premise, depending on the end-user’s requirement accessing the applications. Qlik sense uses the employee token instead of the named user technique in licensing the product. Qlik sense informed that the software would be available and deployed under a single license key on any cloud platform. The price of Qlik sense can be availed for $15 per month and can also be purchased for an annual contract. It is available as a free edition and enables the user to develop multiple visualizations that can be shared among five users. The price of tableau starts from $12 per month on an annual basis and can be used by one user. But few additional modules require a single license for a single product.

2. Accessibility

The visualization of data is a core capability and doesn’t fail to surprise to give an optimal user experience. The tableau makes it easy to leverage the data calculation and visualization and formatting of the dashboards. It doesn’t need to switch between any modes to design and view mode. It invests in processing the natural languages, particularly in designing the BI use case. Hence the tableau gives its best accessibility feature to the end-user. When it comes to ease the creation of data resources, Qlik senses is a powerful software that narrows the associate engine created by Qlik sense which is simple to merge the data from multiple resources. It influences the conversational analysis and artificial intelligence process to access more functions where the tableau is aggressively investigating to reach its maximum efficacy.

3. Implementation

Both Qlik Sense and Tableau can be implemented in a public cloud or on-premise environment. It can be accessed as a software-as-a-service, and Qlik sense can be deployed as cloud-native microservices that can be fed into the required environment. The Kubernetes cluster can be installed on multiple clouds in the Qlik sense. Whereas Tableau is aimed at automating the data preparation process, which makes it easy to kick start.

4. Add-ons and features

The customization of Tableau and Qlik sense requires enough quantity of expertise based on the task complexity. The integrations are available in both the platform and are accessible with a range of connectors to work on the packaged applications and applications programming interface to operate on custom applications. The features and add-ons need a leapfrog advanced update in every release of the software in terms of core features. The beta testing in tableau has an extended gallery which makes it easy to find third-party additional tools.

5. Support

Both Qlik Sense and Tableau gives free support through the website, large online communities, knowledge bases. But both the companies need a separate package to give extended support, and Qlik sense provides reliable support over the call.

Comparison table between Qlik sense vs Tableau

Here are the following comparisons mention below

Attributes Qlik sense Tableau
Features


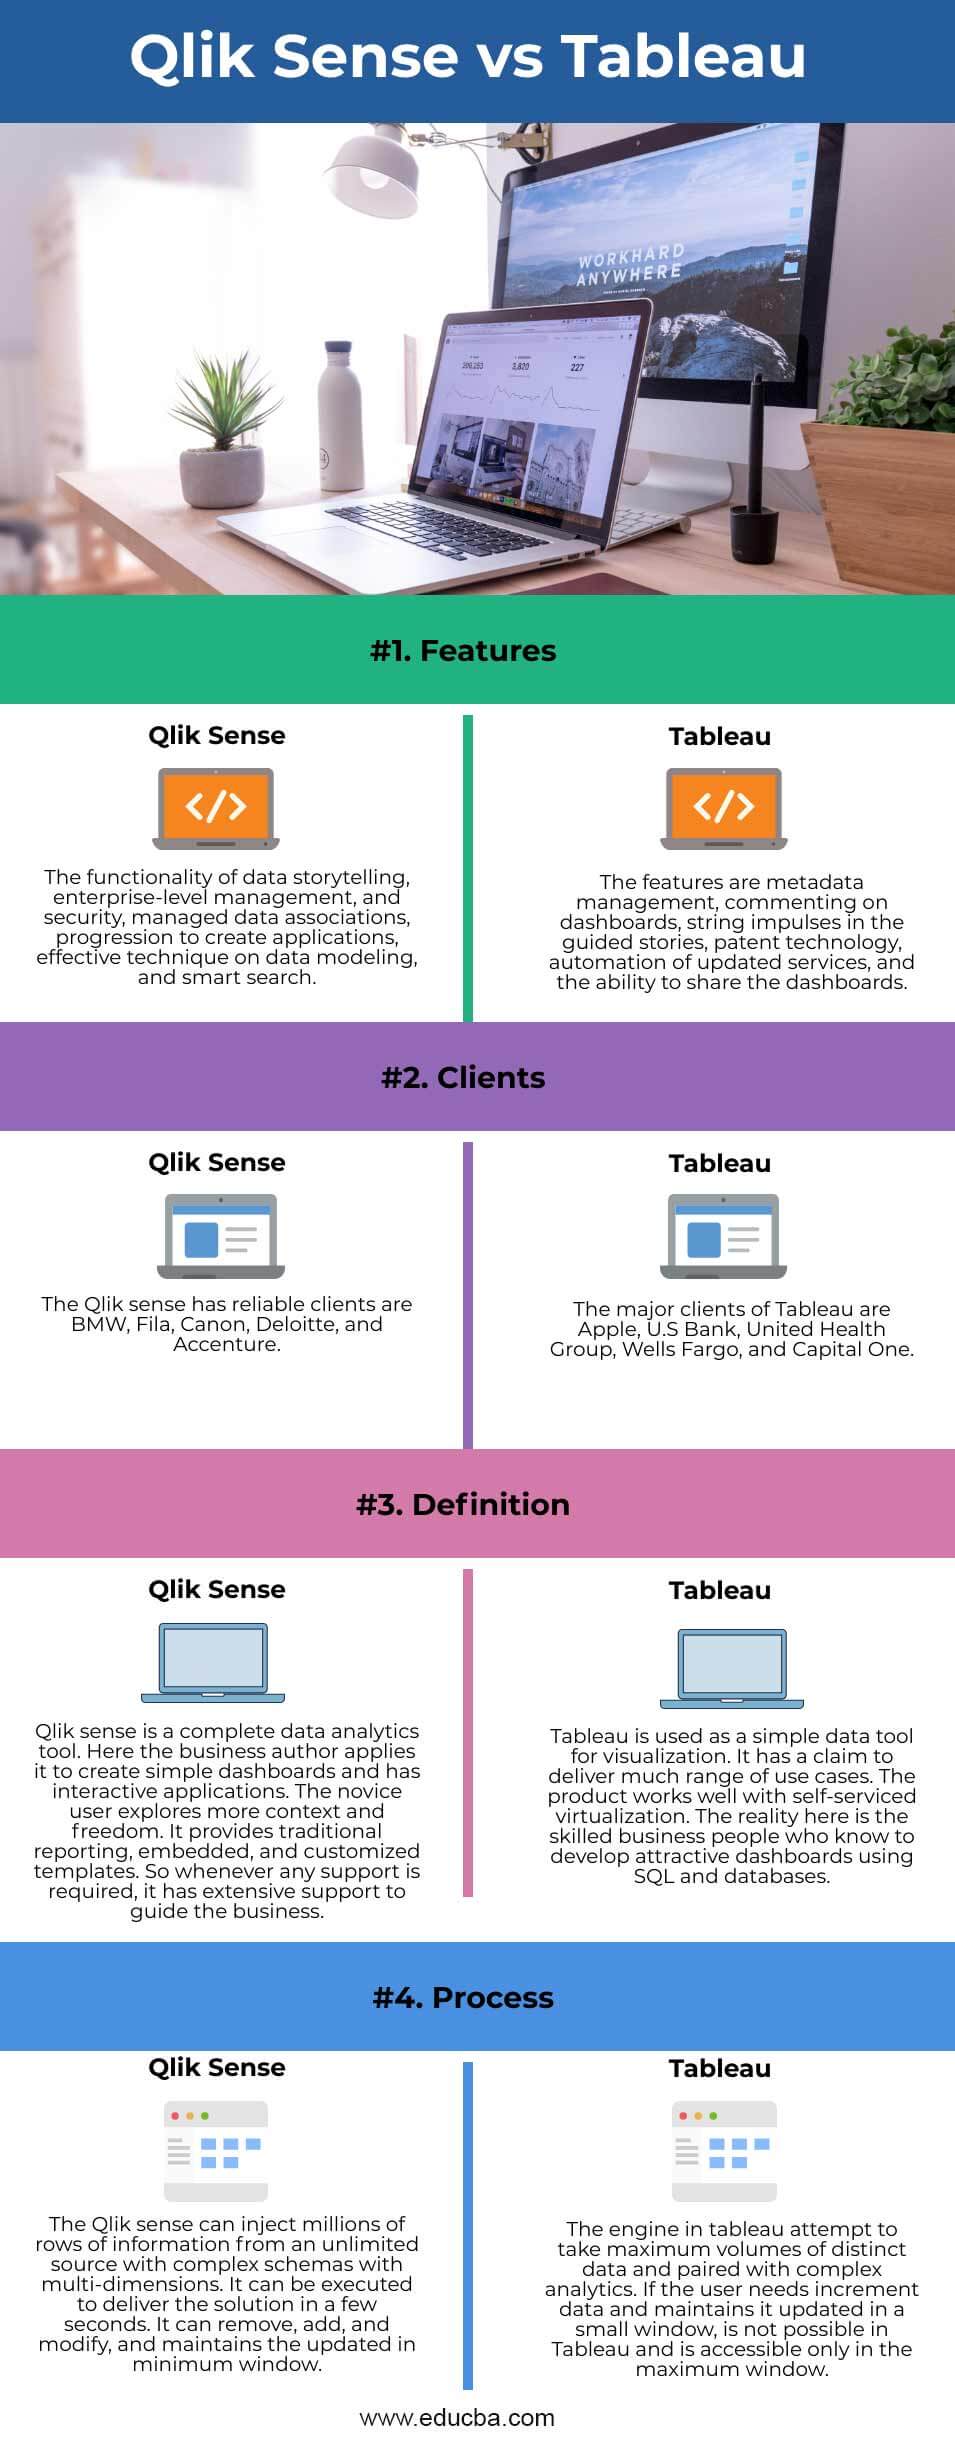
The functionality of data storytelling, enterprise-level management and security, managed data associations, progression to create applications, effective technique on data modeling, and smart search. The features are metadata management, commenting on dashboards, string impulses in the guided stories, patent technology, automation of updated services, and the ability to share the dashboards.
Clients The Qlik sense has reliable clients are BMW, Fila, Canon, Deloitte, and Accenture. The major clients of Tableau are Apple, U.S Bank, United Health Group, Wells Fargo, and Capital One.
Definition


Qlik sense is a complete data analytics tool. Here the business author applies it to create simple dashboards and has interactive applications. The novice user explores more context and freedom. It provides traditional reporting, embedded, and customized templates. So whenever any support is required, it has extensive support to guide the business. Tableau is used as a simple data tool for visualization. It has a claim to deliver much range of use cases. The product works well with self-serviced virtualization. The reality here is the skilled business people who know to develop attractive dashboards using SQL and databases.


Process The Qlik sense can inject millions of rows of information from an unlimited source with complex schemas with multi-dimensions. It can be executed to deliver the solution in a few seconds. It can remove, add, and modify and maintains the updated in minimum window. The engine in tableau attempt to take maximum volumes of distinct data and paired with complex analytics. If the user needs increment data and maintains it updated in a small window, it is not possible in Tableau and is accessible only in the maximum window.


Conclusion

These enterprises failed to give one constant and unique platform for data visualization. Tableau provides the pre-packaged visualized and accessible through mobile computing components. Whereas the data is processed in multiple methods in the Qlik sense.

Recommended Articles

This is a guide to Qlik Sense vs Tableau. Here we discuss Qlik Sense and Tableau key differences with infographics and a comparison table. You may also have a look at the following articles to learn more –

  1. Tableau vs Spotfire
  2. Domo vs Tableau
  3. QlikView vs QlikSense
  4. Power BI vs QlikView
Popular Course in this category
QlikView Training (2 Courses, 1 Project)
  2 Online Courses |  1 Hands-on Project |  9+ Hours |  Verifiable Certificate of Completion
4.5
Price

View Course

Related Courses

Data Scientist Training (85 Courses, 67+ Projects)4.9
Tableau Training (8 Courses, 8+ Projects)4.8
Azure Training (6 Courses, 5 Projects, 4 Quizzes)4.7
Hadoop Training Program (20 Courses, 14+ Projects, 4 Quizzes)4.7
Data Visualization Training (15 Courses, 5+ Projects)4.7
All in One Data Science Bundle (360+ Courses, 50+ projects)4.7
0 Shares
Share
Tweet
Share
Primary Sidebar
Footer
About Us
  • Blog
  • Who is EDUCBA?
  • Sign Up
  • Live Classes
  • Corporate Training
  • Certificate from Top Institutions
  • Contact Us
  • Verifiable Certificate
  • Reviews
  • Terms and Conditions
  • Privacy Policy
  •  
Apps
  • iPhone & iPad
  • Android
Resources
  • Free Courses
  • Database Management
  • Machine Learning
  • All Tutorials
Certification Courses
  • All Courses
  • Data Science Course - All in One Bundle
  • Machine Learning Course
  • Hadoop Certification Training
  • Cloud Computing Training Course
  • R Programming Course
  • AWS Training Course
  • SAS Training Course

ISO 10004:2018 & ISO 9001:2015 Certified

© 2022 - EDUCBA. ALL RIGHTS RESERVED. THE CERTIFICATION NAMES ARE THE TRADEMARKS OF THEIR RESPECTIVE OWNERS.

EDUCBA
Free Data Science Course

SPSS, Data visualization with Python, Matplotlib Library, Seaborn Package

*Please provide your correct email id. Login details for this Free course will be emailed to you

By signing up, you agree to our Terms of Use and Privacy Policy.

EDUCBA Login

Forgot Password?

By signing up, you agree to our Terms of Use and Privacy Policy.

EDUCBA
Free Data Science Course

Hadoop, Data Science, Statistics & others

*Please provide your correct email id. Login details for this Free course will be emailed to you

By signing up, you agree to our Terms of Use and Privacy Policy.

EDUCBA

*Please provide your correct email id. Login details for this Free course will be emailed to you

By signing up, you agree to our Terms of Use and Privacy Policy.

Let’s Get Started

By signing up, you agree to our Terms of Use and Privacy Policy.

This website or its third-party tools use cookies, which are necessary to its functioning and required to achieve the purposes illustrated in the cookie policy. By closing this banner, scrolling this page, clicking a link or continuing to browse otherwise, you agree to our Privacy Policy

Loading . . .
Quiz
Question:

Answer:

Quiz Result
Total QuestionsCorrect AnswersWrong AnswersPercentage

Explore 1000+ varieties of Mock tests View more