Updated March 21, 2023
Introduction to Tableau Reference Lines
Tableau Reference Lines are the identifiers for result comparison and analysis. It can be added to the axis for referencing the constant value or the calculated value. The reference lines can also be associated with confidence intervals in Tableau. An example scenario for the reference lines in the visualization is adding a reference line for sales average equals to $90000 across multiple customer segments in the two-dimensional bar chat representation. Tableau reference lines can be customized and applied based upon the business requirements. Some of the aggregations the reference lines support such as sum, average, total, constant, maximum, minimum and median.
How to Use Reference Lines?
Following are the Step to use Tableau Reference lines:
Step 1: Log in to Tableau Desktop or Public.
Step 2: Connect to the Database.
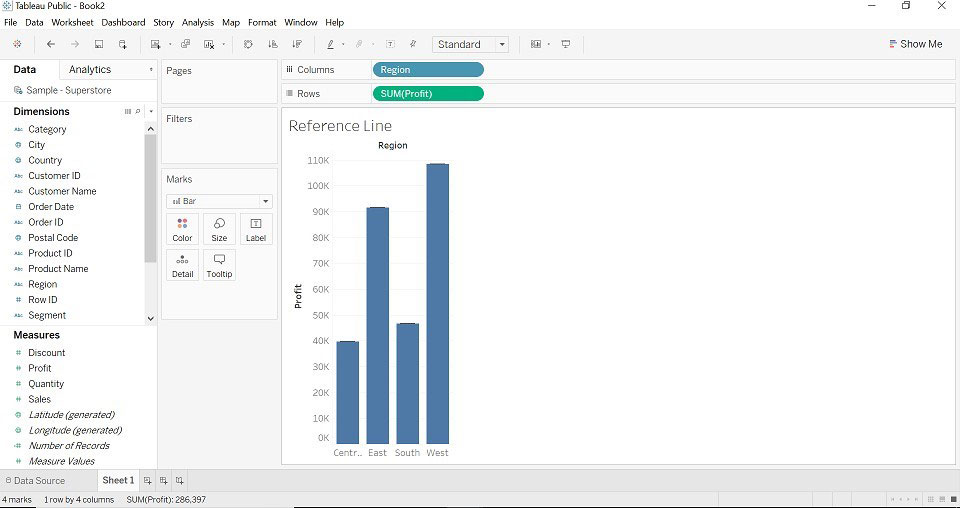
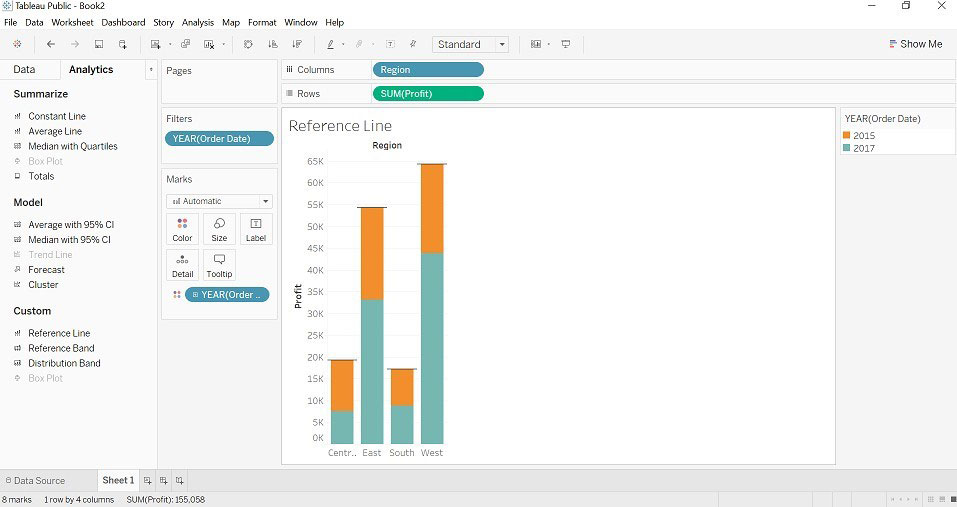
Step 3: Drag Region Dimension to Columns, Profit Measures to Rows. You will get a below image (select bar chart – as you want chart type)
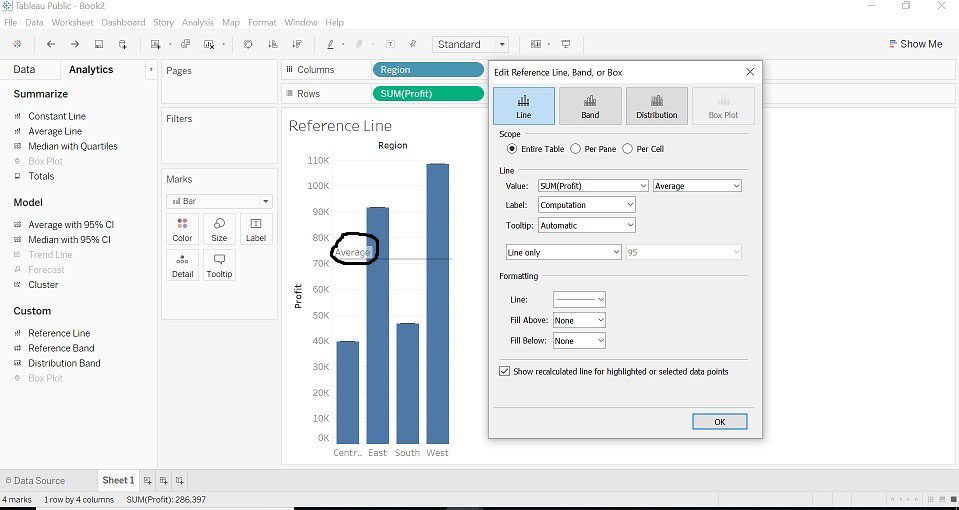
Step 4: Drag Reference Line from Analytics into the views.
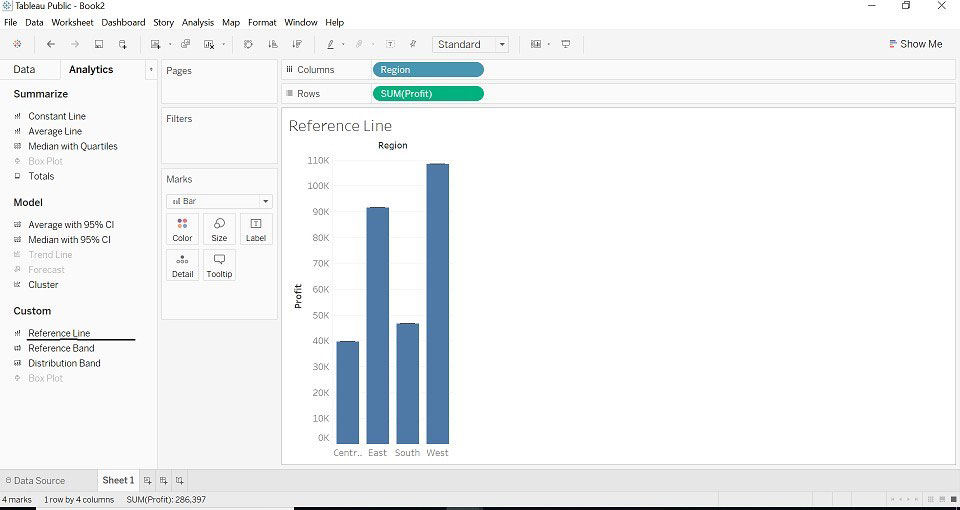
Step 5: Tableau will show the possible range of choices varies depending on the type of item and current views.
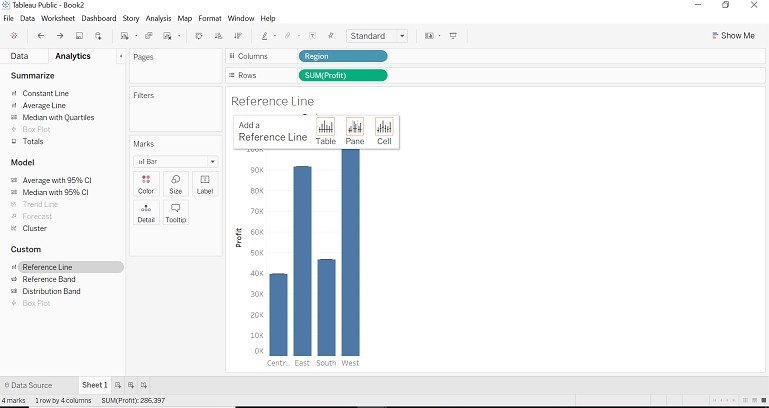
Step 6: The line will show three different scopes for the item.
- Entire table
- Per pane
- Per cell
Entire Table
- When we select scope as the Entire Table, Tableau will perform aggregation for the entire table. Scope as an Entire Table will add a reference line to the entire table.
- Look at the average on the bar chart.
Per Pane
- When we select Scope as Per pane, Tableau calculates aggregation for each pane. Scope as Per Pane will add a reference line to each pane.

Per Cell
- When we select Scope as Per Cell, Tableau calculates aggregation for each cell for the selected table. Scope as Per Cell adds a reference line to each cell.
Aggregations Present for the Reference Line
Following are the line below:
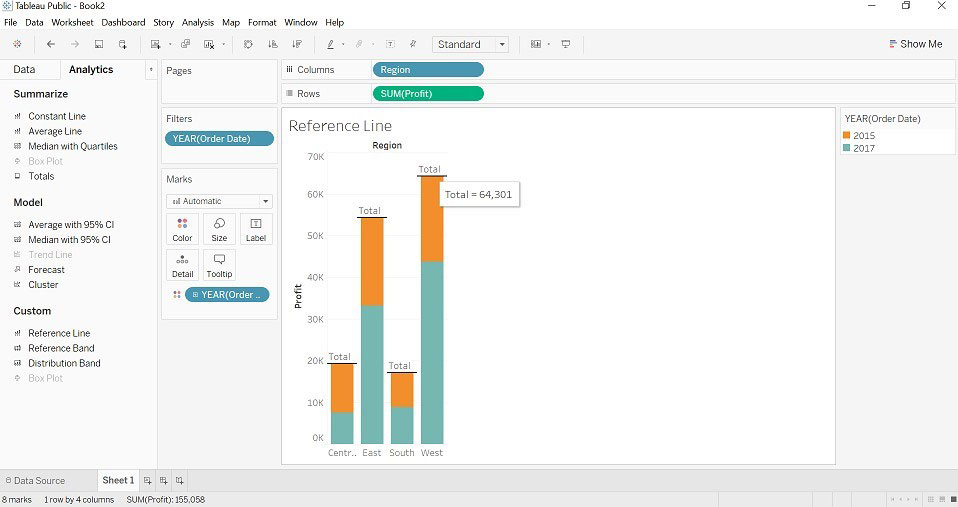
- Total: Total will position line at the aggregation of all the values of a specific measure. (profit)
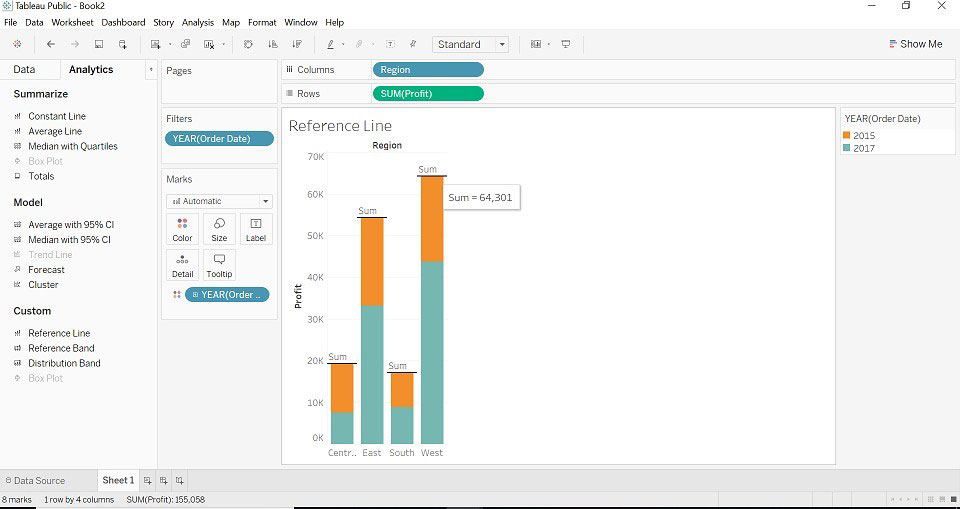
- Sum: Sum will position line at the sum of the selected measure. (Profit)
- Constant: Constant will position line at the constant value which is specified.
- Maximum: Maximum will position line at the maximum of the specific measure. (Profit)
- Minimum: Minimum will position line at the minimum of specific measure. (Profit)
- Average: Average will position line at the minimum of specific measure. (Profit)
- Median: Median will position line at the median of the specific measure. (Profit)
When we select an aggregation as per aggregation type, we want, we can see the result by keeping the cursor on the reference line (reference line will appear as per the entire table, per cell, per pane). Look at the images below, you will get an idea about each aggregation).
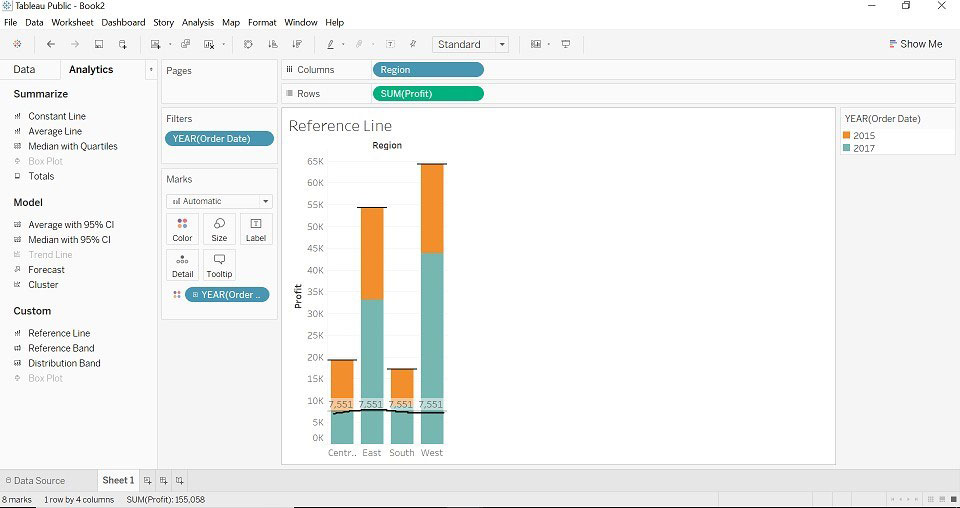
1. Total
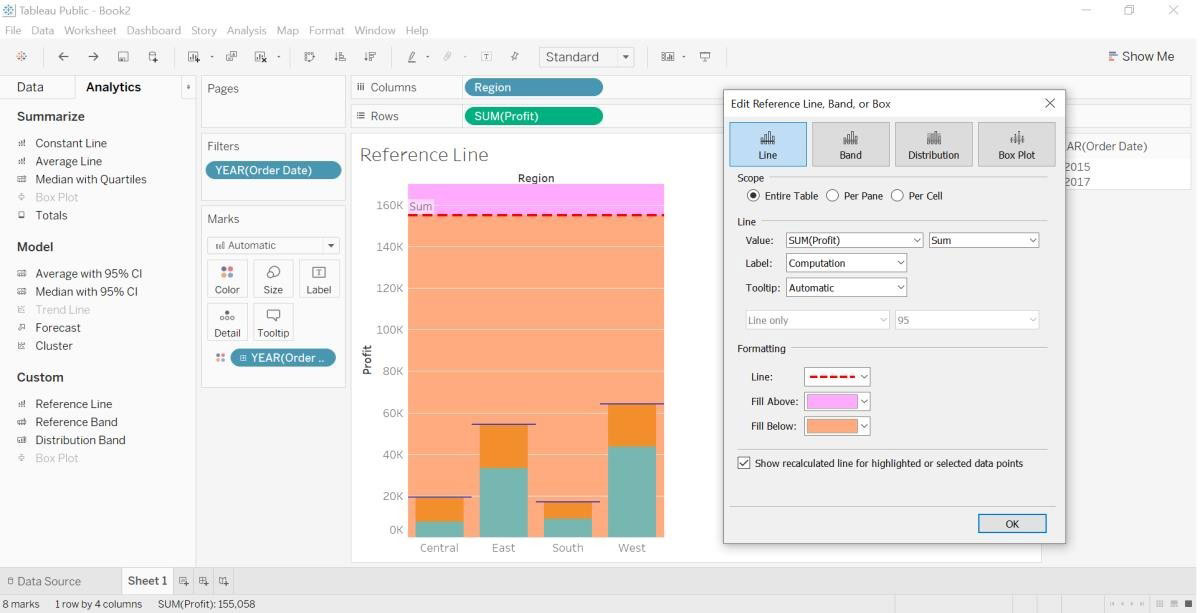
2. Sum
3. Constant
Look at the number present in each bar (the number is constant value).
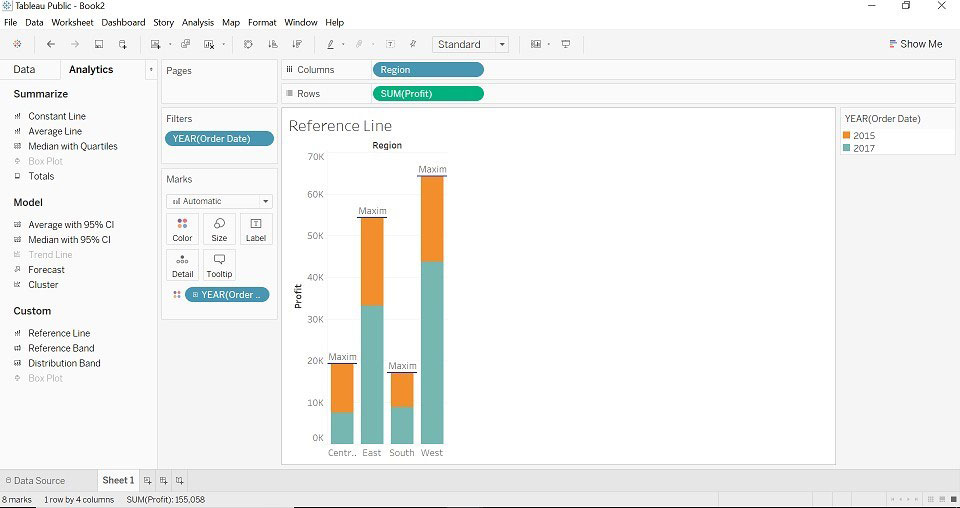
4. Maximum
5. Median

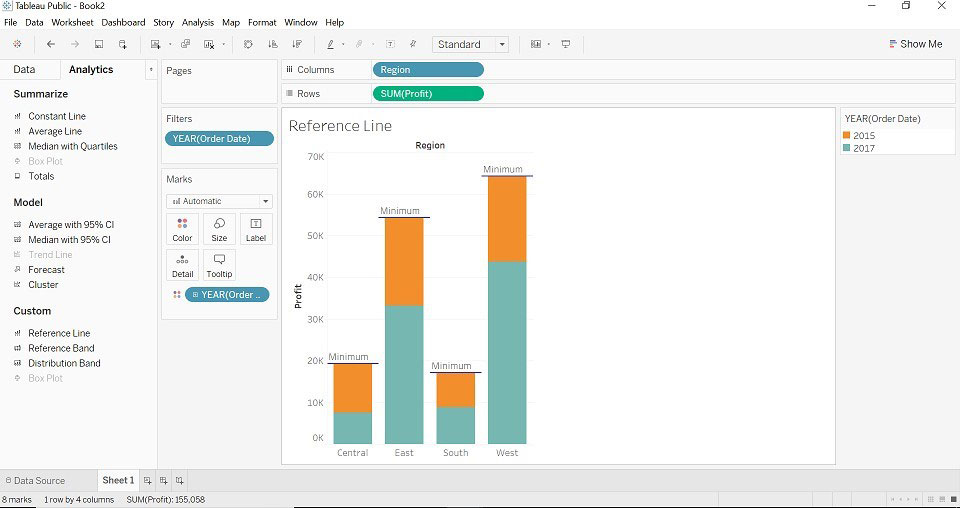
6. Minimum
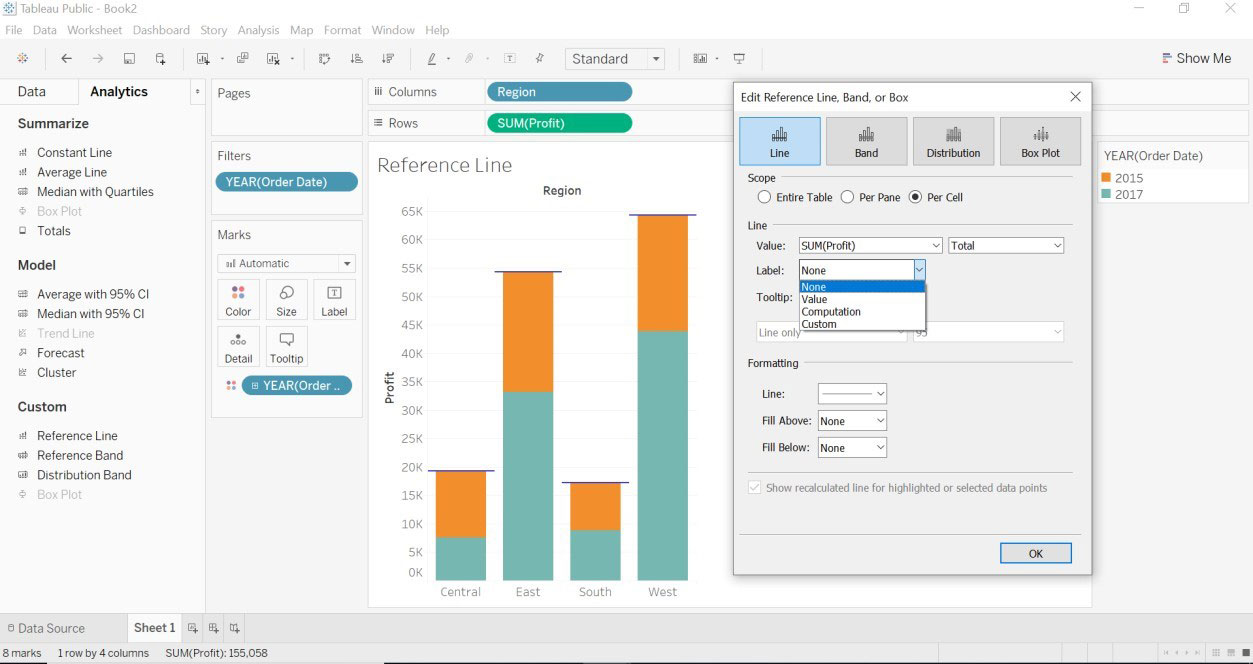
7. Label
This option allows you to configure whether you want to see the label or not. It has different fields.
- None: This option does not show any label to the reference line.
- Value: This option will show the aggregation of the values of the specific measure as a label to the reference line.
- Computation: This option will show the aggregated function name as a label name to the reference line.
- Custom: This option will show the custom value which is specified by you in the text box as the label to the reference line.
For Example: We have selected Label as Value and Aggregation as Maximum and Scope as an Entire Table. The maximum value is 64,301.
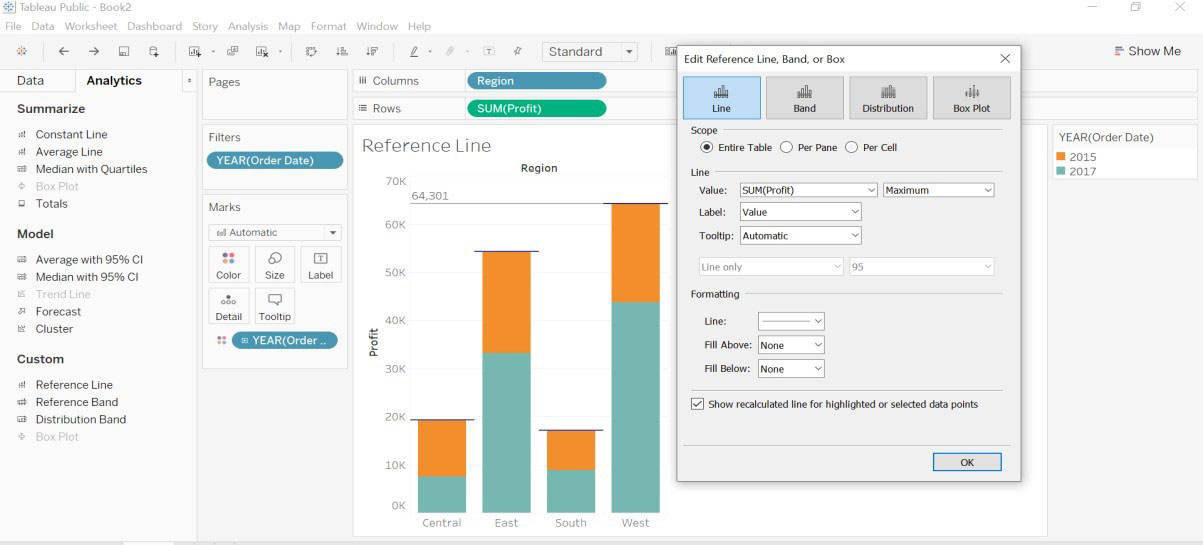
8. Formatting
We can use the formatting option to format the reference line, color, width, and background color- above(fill above) the region and below the region(fill below).
9. Remove Reference Line
Right-click on the Profit axis, it will open the menu and select Remove All Reference Lines.
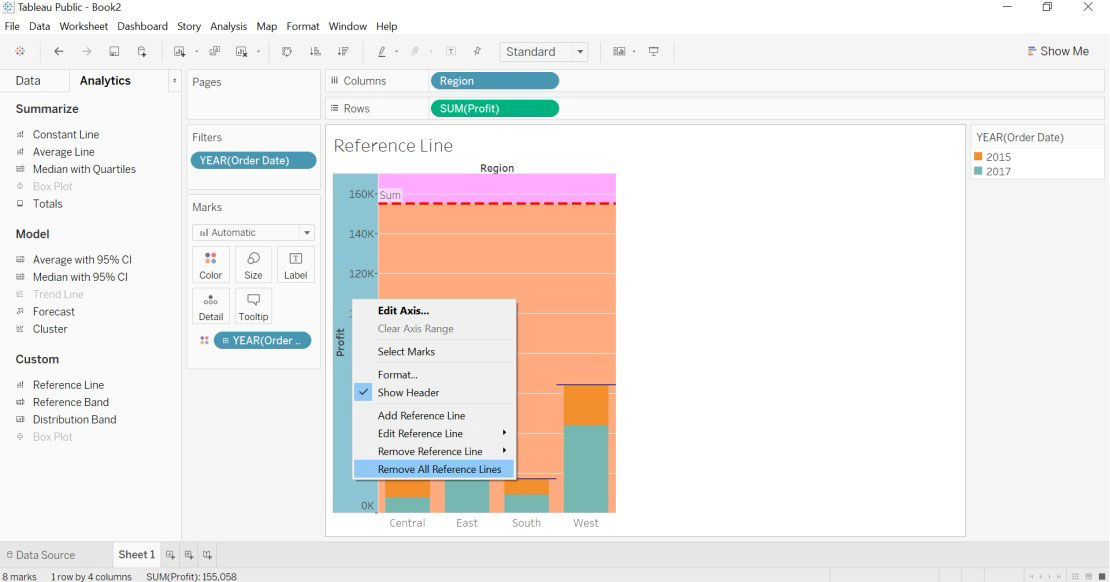
- If your report has only one reference line, then choose the Remove Reference Line option.
- If your report has more than one reference line, then choose the Remove Reference Line option and choose the reference line you want and this will delete the selected reference line.
- If your report has multiple reference lines and you want to remove all the reference lines at one time only, then choose Remove All Reference Lines option.
Recommended Articles
This is a guide to Tableau Reference Lines. Here we discuss how to use Tableau Reference Lines step by step and aggregation in Tableau Reference Lines. You can also go through our other related articles to learn more-
