Updated February 28, 2023
Introduction to Tableau Order of Operations
The order of operation is about the order of execution in tableau. When we perform certain queries or operation there is a pipeline through which query gets executed. The operation such as create different types of graph, apply filters such as color, size, text, create calculation fields, create the view, etc. There is a procedure to produce results as a filter or view, tableau cannot produce anything you want. Data gets manipulated while performing any operation. When we get to know each level of detail about the process it will be an advantage for users. There is always an advantage of understanding every level of operation in tableau.
How to do an Order of Operation in Tableau?
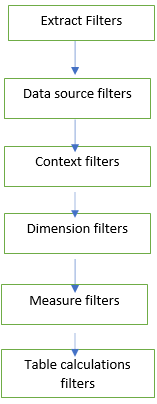
We are going to show the flow of filters in tableau. Each filter has its own values or way to work with tableau data. Extract filter is used for extracting data file, it can be present in forms like excel, text, online server, JSON file, etc. A data source filter is for extracting data sources such as file dragged to, the table gets created into data source sheet. Context filter contains filters such assets, conditional filter, top N, these would be used for finding value from the context. Dimension filter contains data blending which is used for combing two axes into one which will give us more certainty of the data. Measure filter is used for measure value such as the forecast of temperature, weather or table calculation we can create a calculated field for the numeric data. Table calculation filter contains a trend line and the reference line will provide insight into the data and will highlight trends in data.
Examples to Implement Tableau Order of Operations
Below are the examples:
Example #1
We will work with the context filter and will see how this filter will help us to speed up the query performance and result of the data. We will convert the dimension filter to the context filter.
- Open the tableau desktop or public version.
- Open sample superstore dataset or you can use the dataset of your choice (from tableau site you can get n number of the different dataset). This is nothing but the extract filter.
- Drag the order table into the data source filter.
- Drag sales measure to columns
- Drag customer Name dimension to
- Drag city dimension to
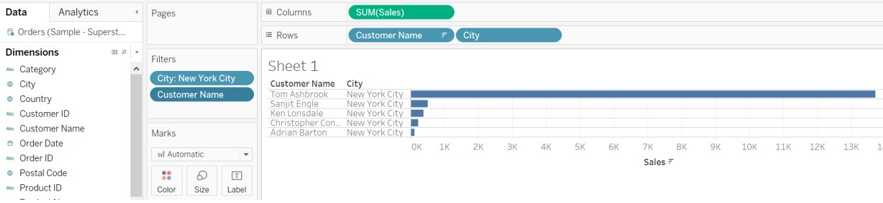
- Drag city to Filters -> click on none ->select New York City (you can select of your choice).
- Drag customer name to Filters -> click on Top -> select By Field as Top
When you click on Top 10 you will get to see the result as only 5 results because Top and dimension filter is applied simultaneously. Now add context filter to the city filter.
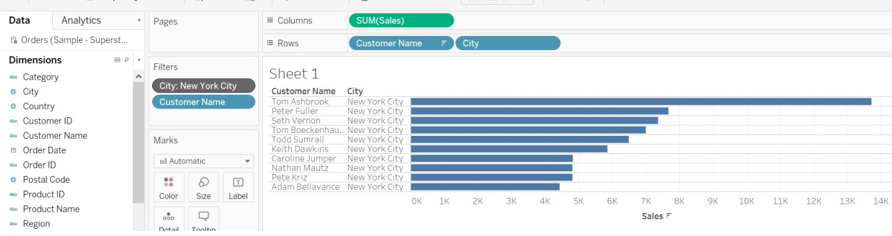
- Right-click on city Filter -> select add context You will get to see the result as Top 10 customer as per the sale.
Examples #2
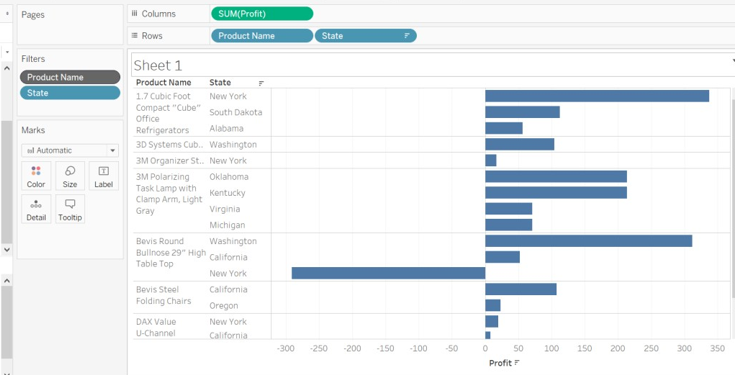
We are going to show the profit as per the state and product name.
- Drag profit measure to
- Drag product name and state dimension to
- Drag product name to filters and select some of the
- Drag state to filter -> go to the Top -> click by field and select the top
- Click on product name -> select add to the
When will add context view, measure color will get changed. You can see the color of Product Name.
Example #3
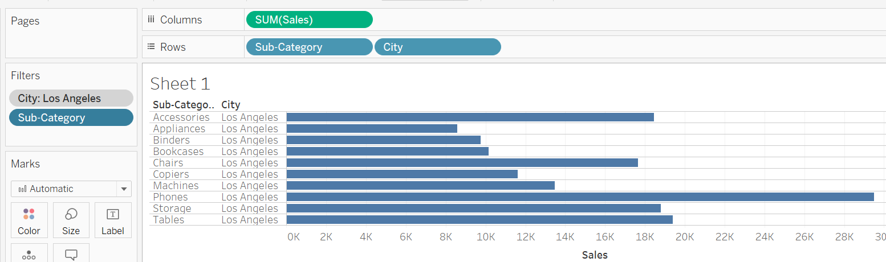
- Drag sales measure to columns.
- Drag sub-category and city dimension to
- Drag the city and sub-category to
- Select the city like Los Angeles from
- Sub-category from Filters -> go to Top -> select By
- Add context filter to the city. Click on the city ->add to the context
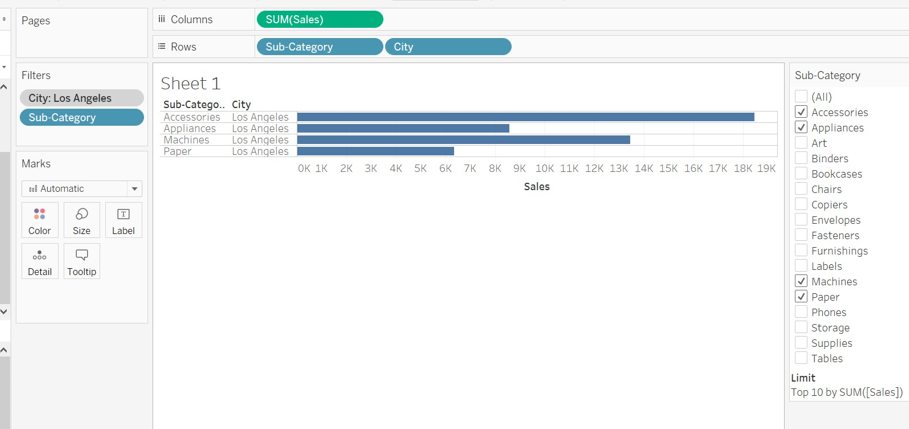
- If we select two or three sub-categories from filter then the result will be different, it might show the top 10 or less than 10.
- You can observe in the below image we have selected sub-category as Accessories, Appliances, Machines, and Paper. We can observe that the limit is set to 10.
- But we are not getting the top 10 results because selected categories have less than 10 data assign to.
Conclusion
We have learned about the order of operation in tableau. Sometimes we don’t get the result as expected because there is a pipeline of executing tableau function. We don’t get through it then we are getting results as an error. It is always god to follow the order of operation which will simplify the execution of the tasks or operation performed.
Recommended Articles
This is a guide to Tableau Order of Operations. Here we discuss an introduction, how to do an order to operate and examples to implement for better understanding. You can also go through our other related articles to learn more –
