Updated March 22, 2023

Introduction to Tableau Dynamic Parameters
The parameter is a variable that takes a value assigned or passed by the user dynamically. Tableau allows us to create, work with and utilize dynamic parameters in the analysis. Dynamic parameters have special significance in visual analytics as they allow us to understand various scenarios and changes based on different parameter values. Also, the parameter is often the important control variable in the entire analysis. In Tableau, we can create parameters with Integer, Float, Boolean, String, Date and Time formats. The use of each of these types is context-based and they should be employed correctly lest parameter application gives inappropriate insights.
Steps for Creating Dynamic Parameters in Tableau
Now, let’s proceed to understand how dynamic parameters are created and utilized. For this demonstration, the data contains Profit (in percentage) and Sales (Million INR) for twenty major Indian cities. We will create a dynamic parameter to sort the result either by Profit or Sales or in Alphabetical order of the City labels as mentioned by the user.
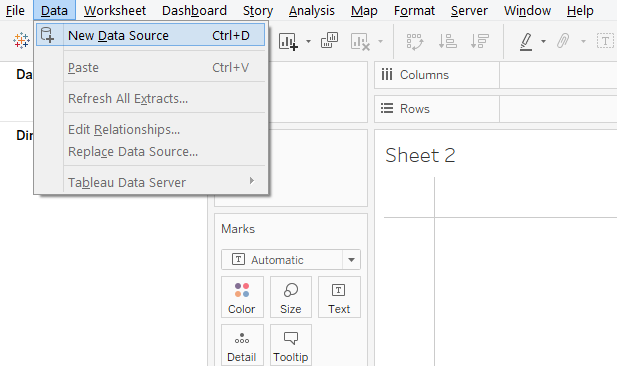
Step 1: Load the data source into Tableau. Click on the Data menu and click on “New Data Source”. Alternatively, click over “Connect to Data”.
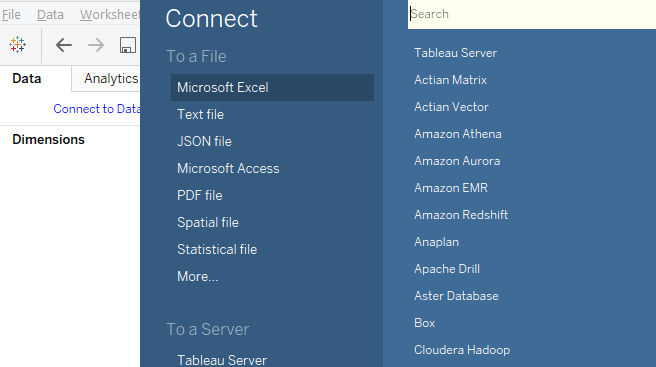
Step 2: Next, select the requisite data source type. In this case, the data is present in the Microsoft Excel file, so click on Microsoft Excel.
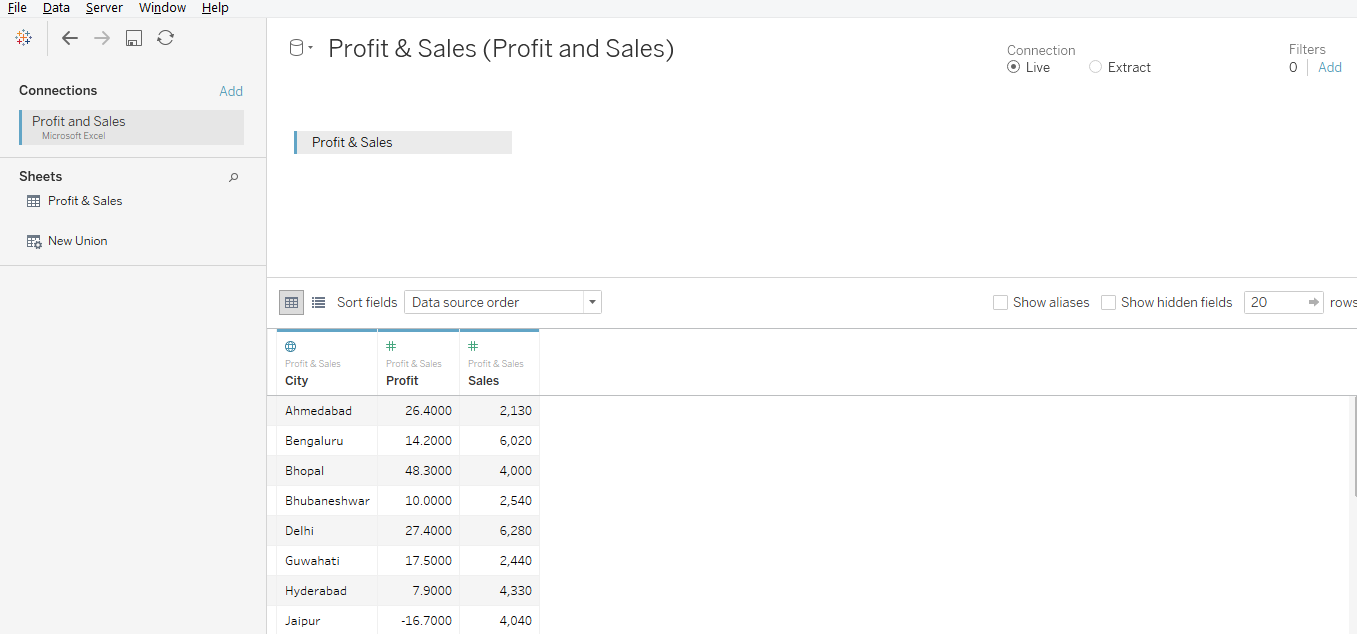
Step 3: The data gets loaded into Tableau as can be seen below.
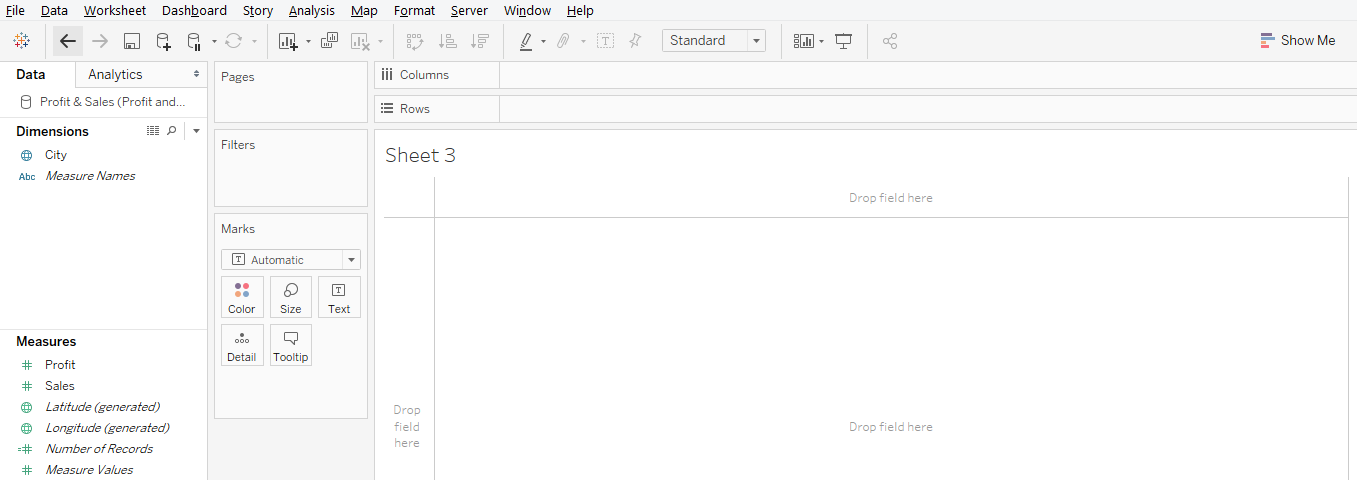
Step 4: Moving to the sheet tab gives us a glimpse of the dimensions and measures present in the data. As we can see, in this case, we have one dimension i.e. City and two measures viz. Profit and Sales.
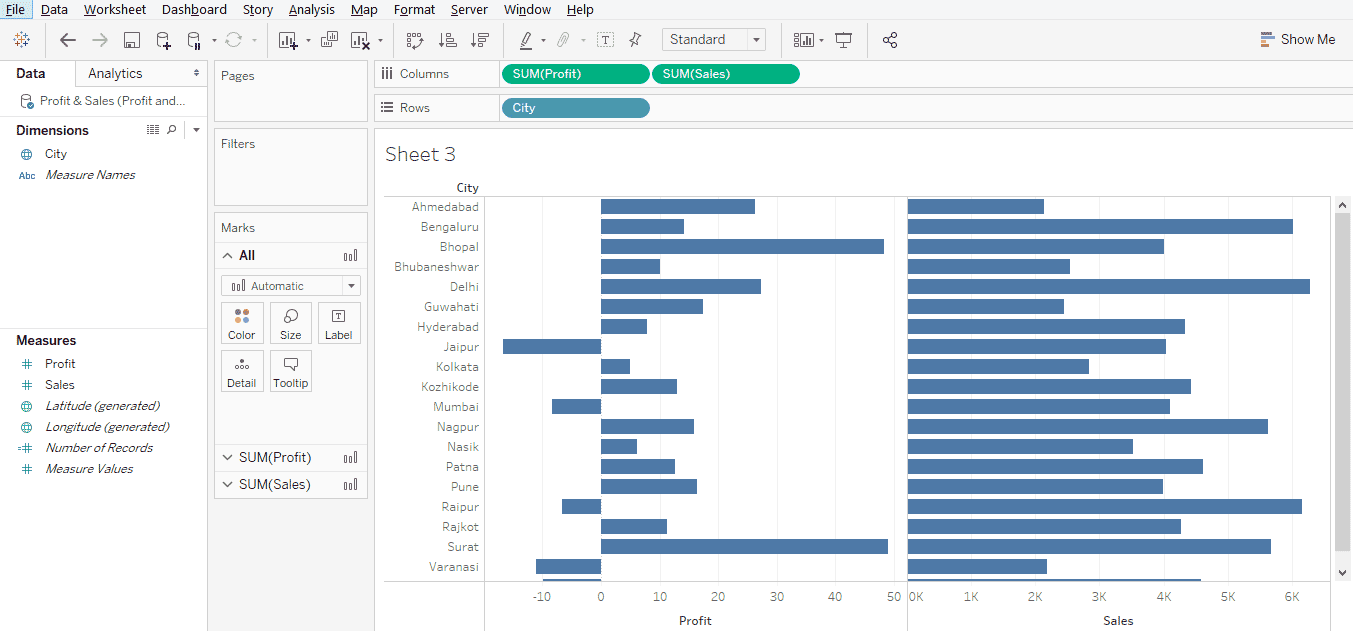
Step 5: Once the data gets successfully loaded into Tableau, drag measures and Profit and Sales into Columns region and dimension City into Rows region. As can be seen below, we get city wise horizontal bar charts for Profit and Sales. If the default chart type is not a bar chart, select it from “Show Me”.
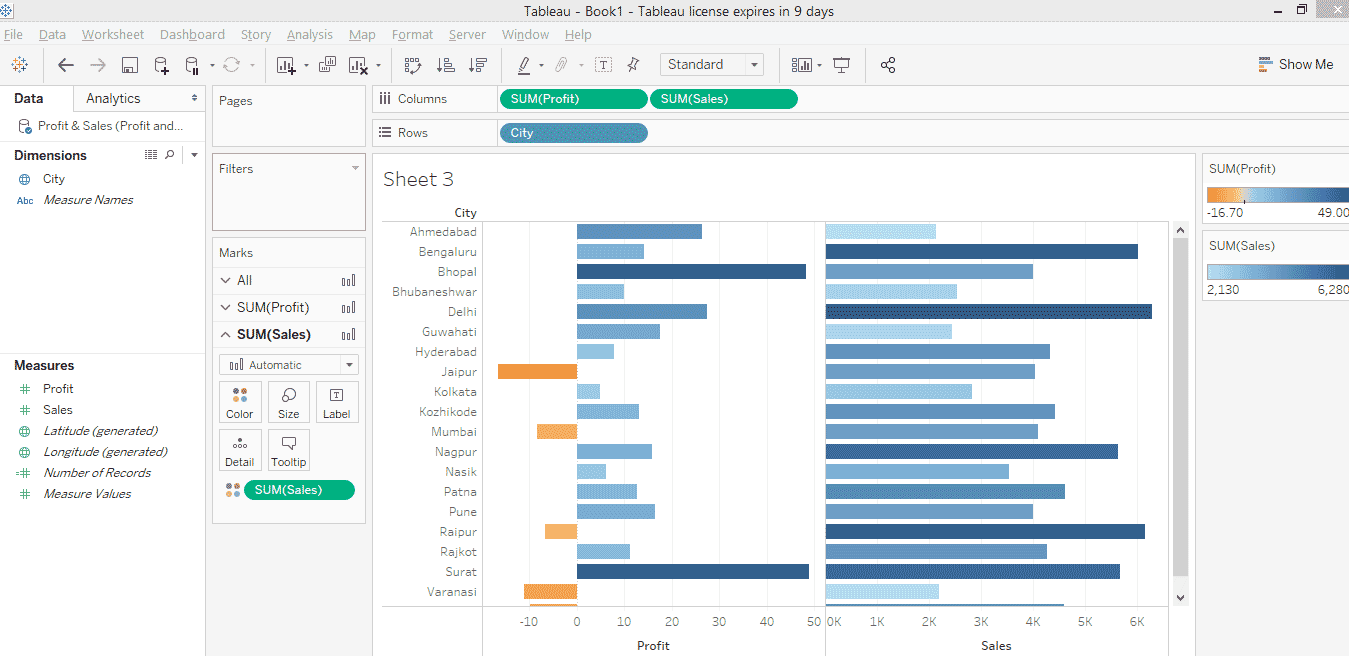
Step 6: The above visualization just generates bar charts. However, we can make it more insightful by dragging measures over Color in Marks card. This is especially useful in case of Profit as some of the Profit values are negative. Color variation based on values is thus always useful. So, drag Profit over Color in SUM(Profit) section in Marks card and similarly drag Sales over Color in SUM(Sales) section in Marks card. This is illustrated by the following two screenshots. As we can see, for measure Profit, now, negative values have been highlighted in orange color as against blue for positive values.
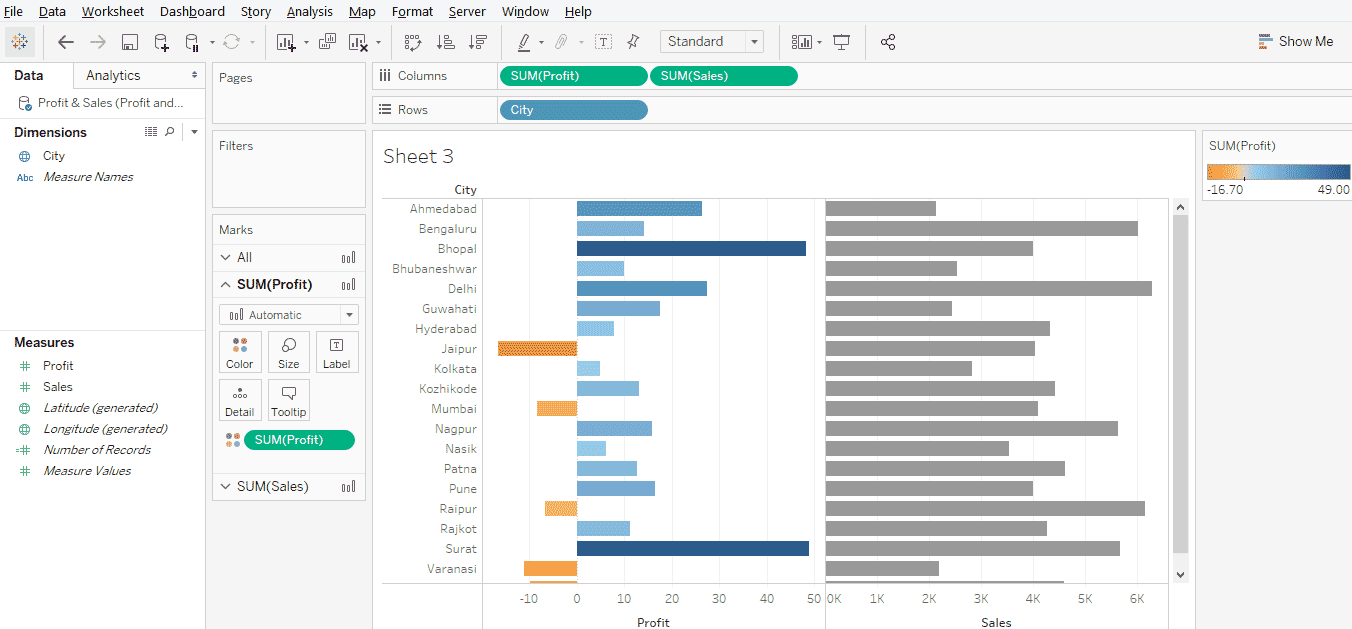
Moreover, the shade of the color changes based on the value.
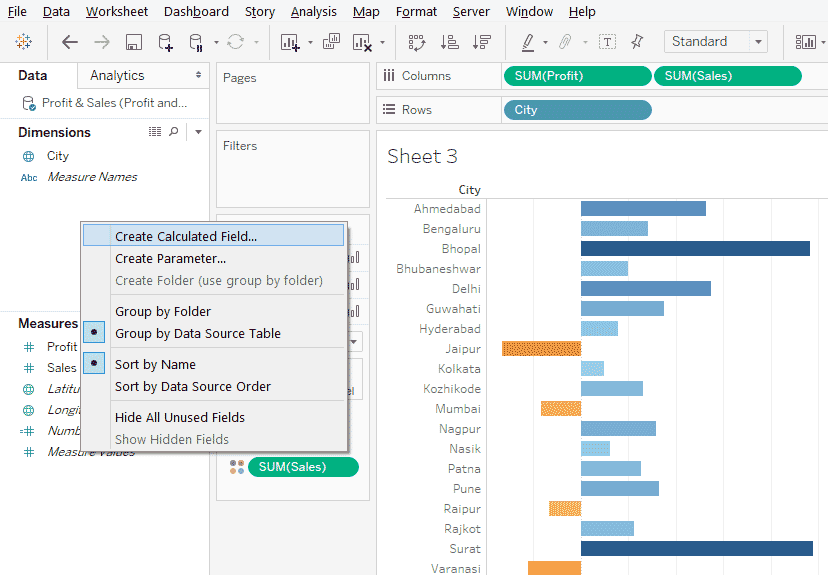
Step 7: Our task is to make a sorting dynamic. For that, we’ll create a parameter. Right-click anywhere in the blank space in the Data section as shown in the below screenshot.
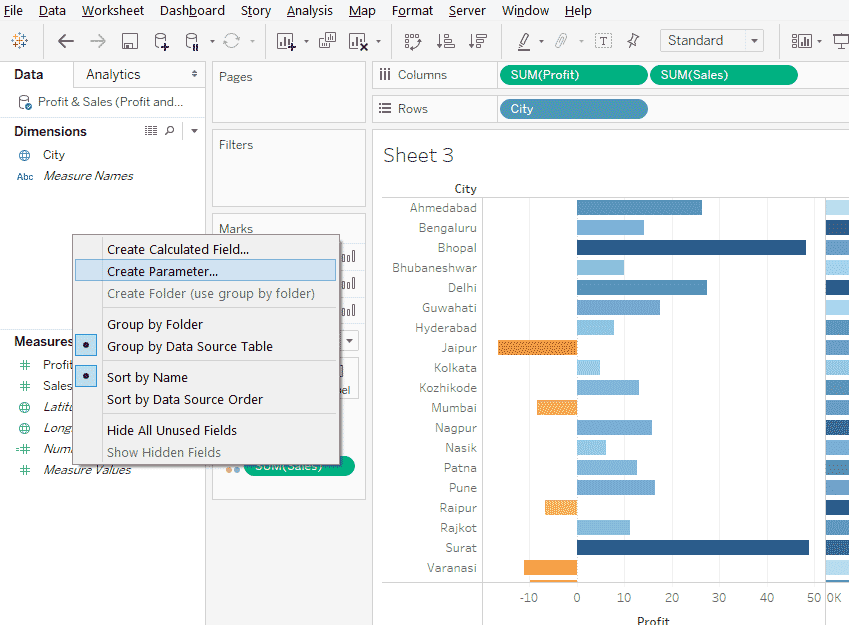
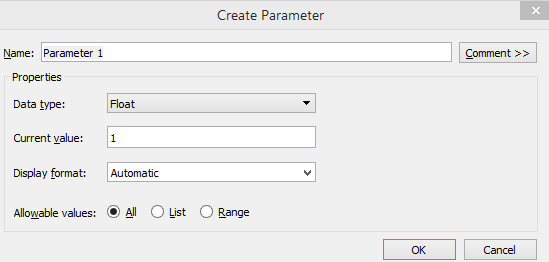
- This will pop-up the “Create Parameter” dialogue box as shown by the subsequent screenshot.
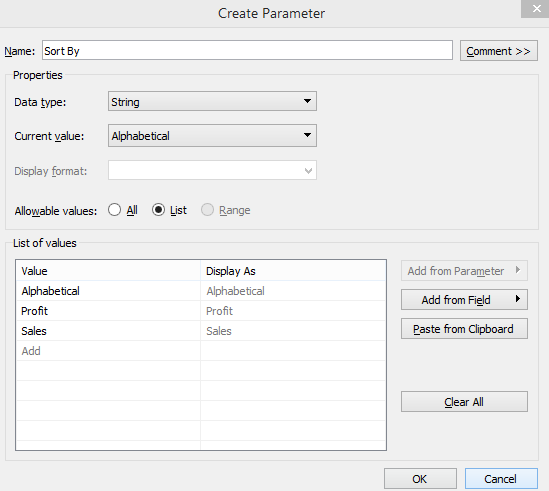
Step 8: In the “Create Parameter” dialogue box we will make some important changes. First, Change the Name to “Sort By”. In “Data type” select “String”. Click on “List” in Allowable values. Once, we select List, we need to create a list of values. The list should be created as below. As we are considering three sorting options, in this case, we created a list with three values. A list of values should be created based on the context. Once done, click on OK and our parameter is ready.
Step 9: Next, create a calculated field. Creating a calculated field is necessary as we are going to embed the parameter “Sort By” into this calculated field for dynamic sorting. To create Calculated Field, right-click anywhere in the blank space in the Data section, and click on “Create Calculated Field”.
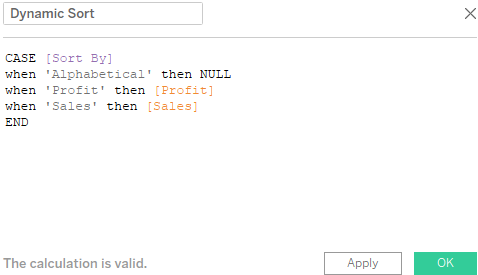
Step 10: Name the calculated field as “Dynamic Sort”. Any suitable name can be given based on the context. As can be seen, the CASE statement code written in the calculated field makes use of parameter “Sort By”. So, based on the value of the “Sort By” parameter, the Case statement will work and we will use this parameter-calculated field combination for dynamic sorting. Once the code is written ensure that “The calculation is valid” message is displayed at the bottom left corner as can be seen below, then click on Apply and then on OK.
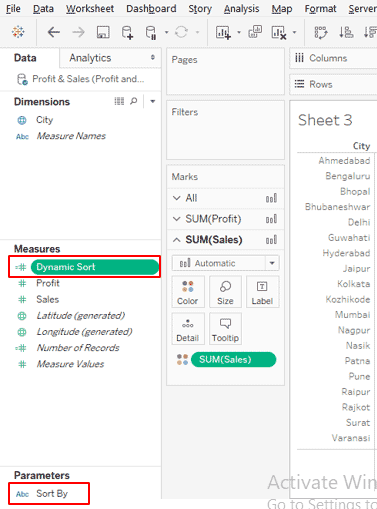
Step 11: The newly created parameter and calculated field appear in respective sections as can be seen in the below screenshot.
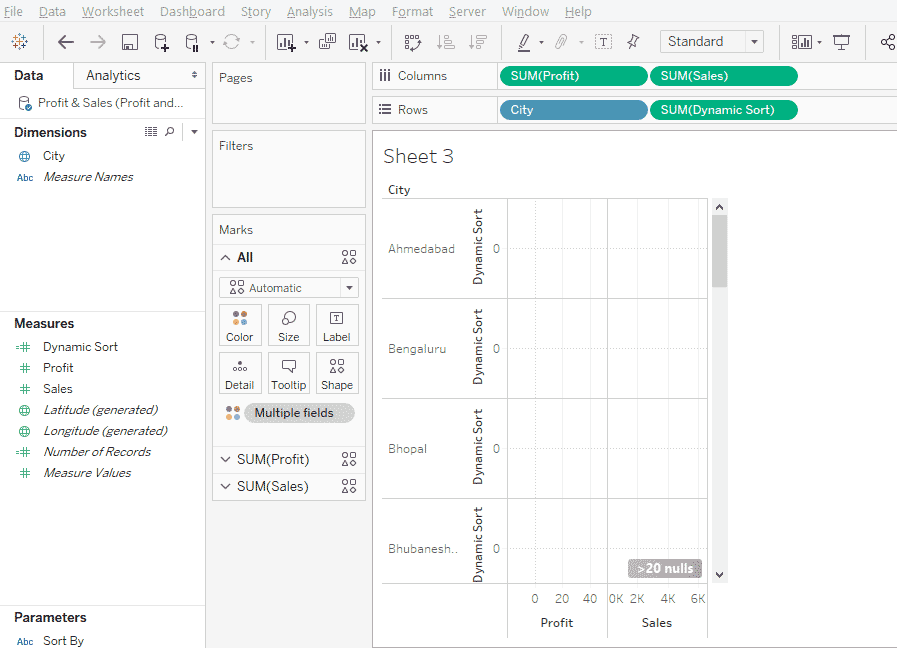
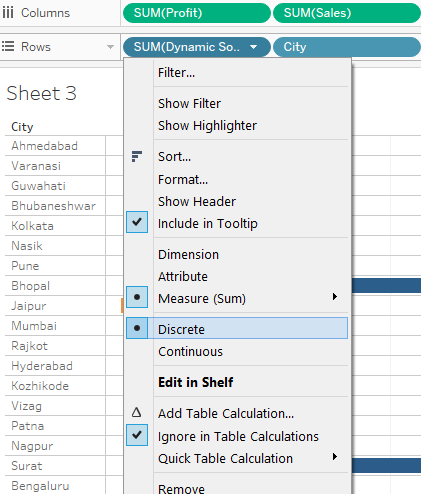
Step 12: Let’s use the calculated field “Dynamic sort”. Drag it into Rows region and as we can see in the below screenshot, we get an inappropriate result. To overcome this, just convert the type of the calculated field from Continuous to Discrete. This turns its color to blue.
- The screenshot subsequent to the below one shows this. Once, the type is changed to Discrete, in the Rows region, drag the Dynamic Sort field to the first position before the City dimension. If the calculated field isn’t in the first position, then dynamic sorting will not work. Because sorting of measures now becomes dependent on the discrete variable which is first in the order.
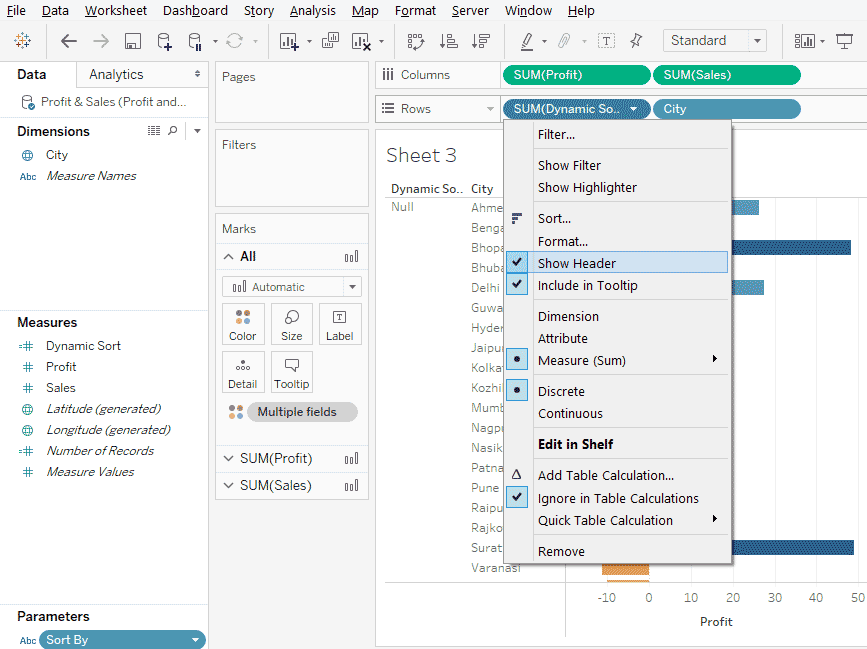
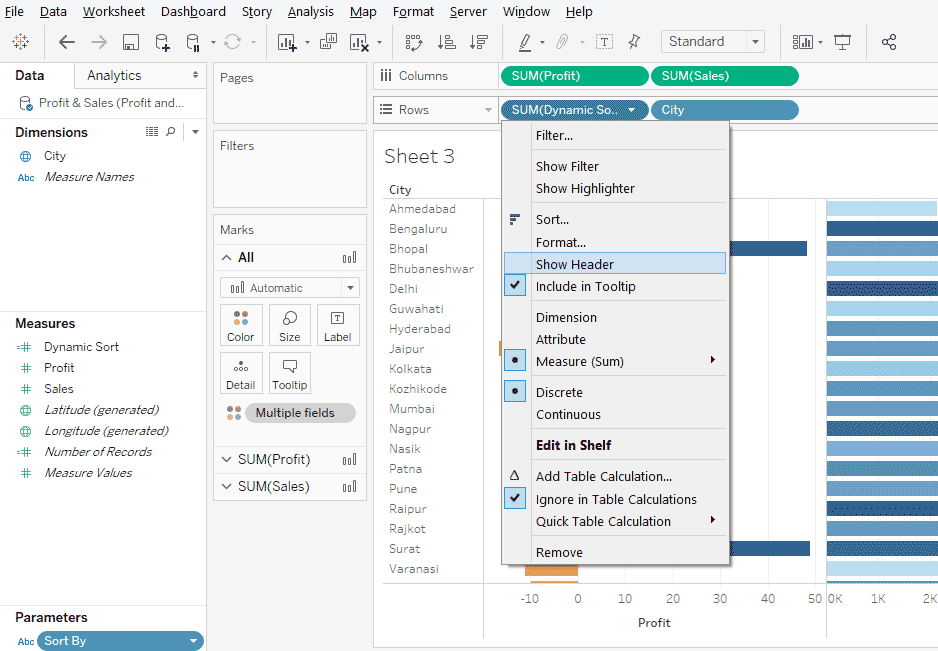
Step 13: We want the result to be sorted based on the calculated field Dynamic Sort, but don’t want it to be there in the visualization, so in the drop-down menu of Dynamic Sort uncheck “Show Header” as illustrated in the below screenshot.
Step 14: As can be seen below, unchecking “Show Header” made Dynamic Sort to disappear.
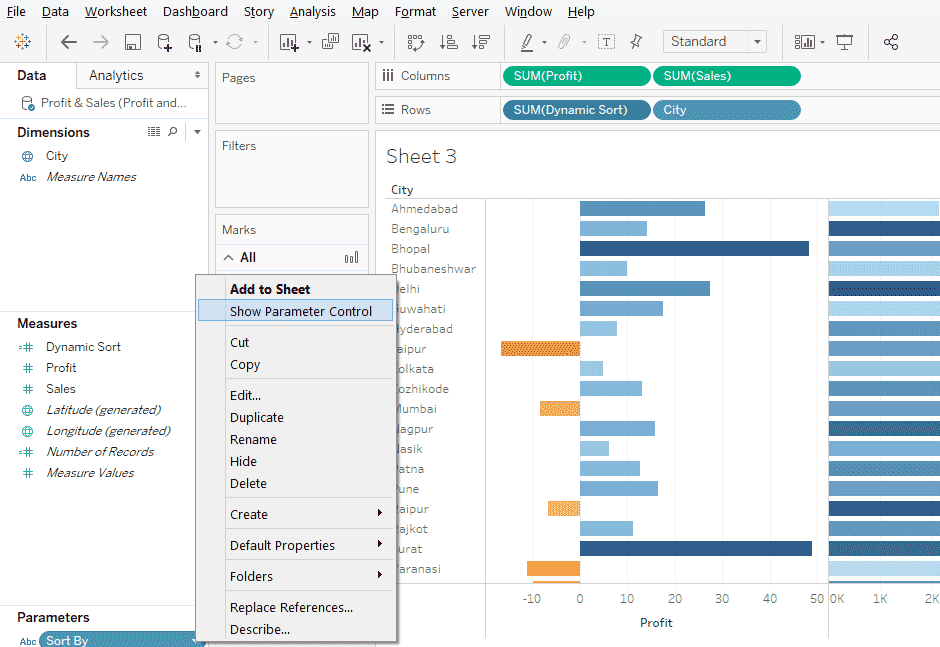
Step 15: Now, we will use the parameter to dynamically sort the result. First make the parameter visible, for that click on “Show Parameter Control” in the pop-up menu of the Sort By parameter.
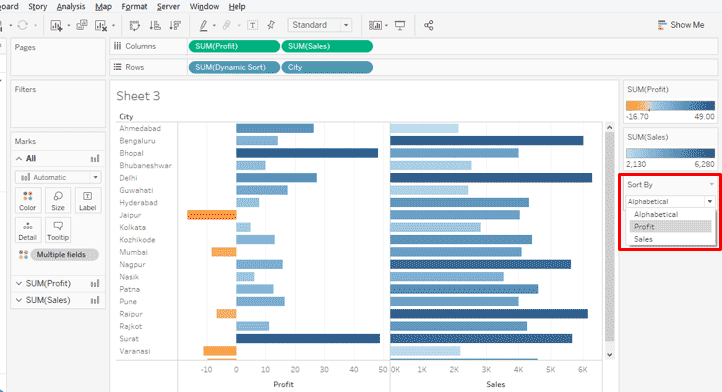
Step 16: The parameter is now visible as can be seen on the right side of the screen. It has three values. The current selection i.e. ‘Alphabetical’ sorts the result in Alphabetical order of City labels.
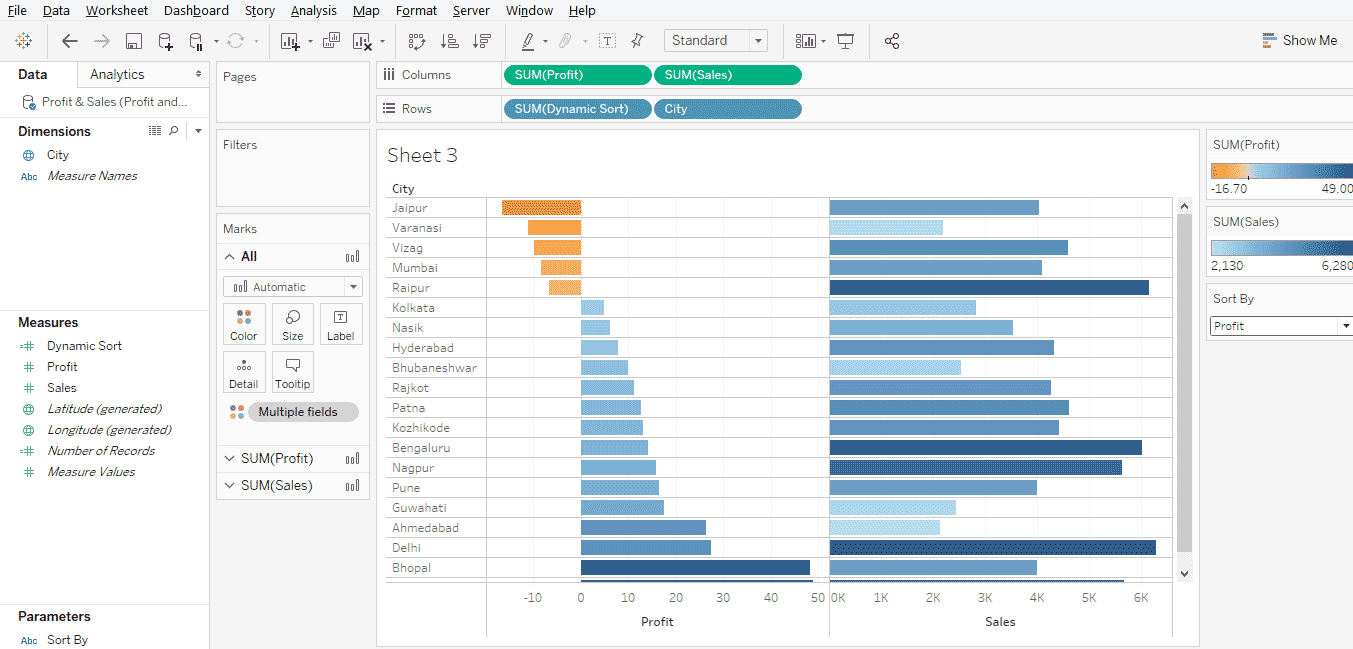
Step 17: We selected Profit in Sort By, and as can be seen the result got sorted in ascending order of Profit Values. Similarly, we can do Sales also.
Conclusion
Dynamic parameters add tremendous value to visualizations and make insight capturing mechanism quick and easier. Tableau offers a robust mechanism to create and utilize dynamic parameters that can take and work with user-specified values. With their easy-to-create and easy-to-implement approach, dynamic parameters in Tableau effectively transforms data into insights.
Recommended Articles
This is a guide to Tableau Dynamic Parameters. Here we discuss the different steps for creating dynamic parameters in tableau. You may also look at the following articles to learn more –
