Updated July 28, 2023
T Distribution Formula (Table of Contents)
What is the T Distribution Formula?
T Distribution is a statistical method used in the probability distribution formula, and it has been widely recommended and used in the past by various statisticians. The method is appropriate and is used to estimate the population parameters when the sample size is small and or when the population variance is unknown.
In this article, we will try to understand the logic behind the formula and the relevance and the same example.
We often use this formula as the Sample size can also be often small, and population variance and the population’s standard deviation are unknown.
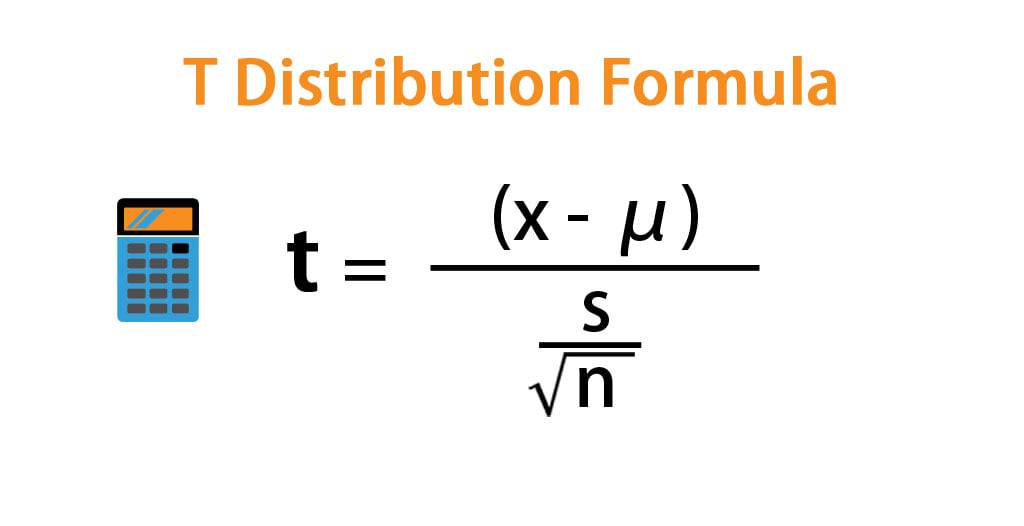
So the formula can be defined as:
- t = T – Distribution
- x = Sample Mean
- μ = Population Mean
- S = Standard Deviation
- n = Sample Size
Examples of T Distribution Formula (With Excel Template)
Let’s take an example to understand the calculation of T Distribution in a better manner.
Example #1
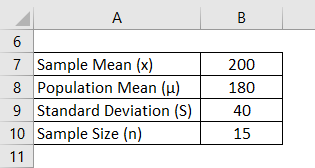
The engineer of a water company that manufactures water pumps claims that the average water pump can last 200 days. However, while searching, a researcher found out that an average water pump can last only 180 days with a standard deviation of 40 when selected from a random sample of 15 pumps for the purpose of testing. So, if the engineer’s claims were true, we need to determine the probability that a randomly selected 15 pumps would have an average life of more than 200 days?
First, to solve this problem, we need to identify the variables in the problem.
Here are the variables.
T Distribution is calculated using the formula given below
t = (x – μ) / (S / √n)
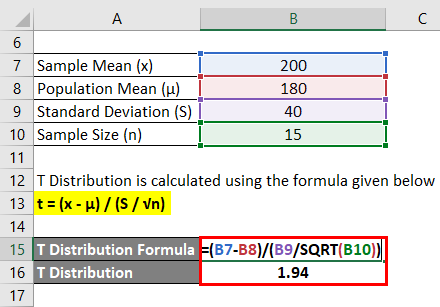
- T Distribution = (200 – 180) / (40 /√15)
- T Distribution = 20 / 10.32
- T Distribution = 1.94
Example #2
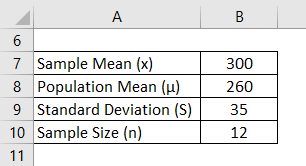
The CEO of a startup is evaluating the license terms of its contracts and finds that the average contract lasts 300 days. An auditor while auditing the license terms of the contracts finds out that an average contract lasts 260 days with a standard deviation of 35 when selected from a random sample of 12 contracts for the purpose of testing. If the auditor claims were true, we need to find out the probability that randomly selected 12 contracts would have an average life of more than 300 days?
First, to solve this problem, we need to identify the variables in the problem.
Here are the variables.
T Distribution is calculated using the formula given below.
t = (x – μ) / (S / √n)
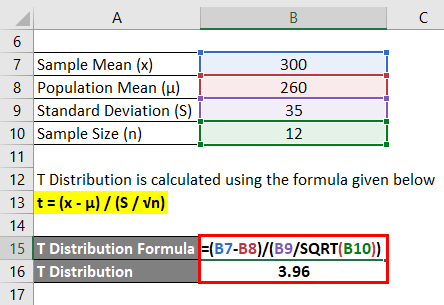
- T Distribution = (300 – 260) / (35 / √12)
- T Distribution = 40 / 10.10
- T Distribution = 3.96
Example #3
Solve the given variables to find the T- distribution
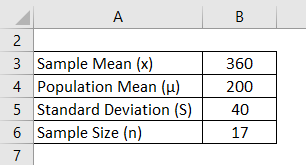
T Distribution is calculated using the formula given below
t = (x – μ) / (S / √n)
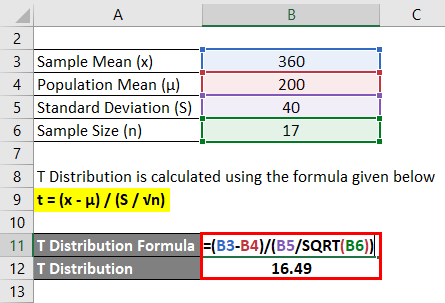
- T Distribution = (360 – 200) / (40 / √17)
- T Distribution = 160 / 9.70
- T Distribution = 16.49
Explanation
Going to the formula in detail, a random variable that is being standardized is being subtracted from the mean of the distribution and is then divided by the Standard deviation of the distribution. Once these terms are determined, we can simply calculate the T distribution.
We have assumed here that the sampling distribution will follow a normal distribution as long as the sample size is small.
The T-Distribution formula is used to compare the expected data with the sample data to be obtained from a specific hypothesis. T- Distribution is also one of the most useful formulas available to a behavioral scientist. T-Distribution is used when the population parameters (mean and standard deviation) are not known.
Relevance and Use of T Distribution Formula
The formula is used in the following fields-
- Sampling and probability distribution.
- Used in a specific hypothesis.
- In the test of the significance level hypothesis, the formula is used.
T Distribution Formula Calculator
You can use the following T Distribution Calculator
| x | |
| μ | |
| S | |
| √n | |
| t | |
| t = |
|
|
Recommended Articles
This is a guide to T Distribution Formula. Here we have discussed how to calculate T Distribution along with practical examples. . We have also provided a T Distribution calculator with a downloadable excel template. You may also look at the following articles to learn more –
