Updated March 24, 2023
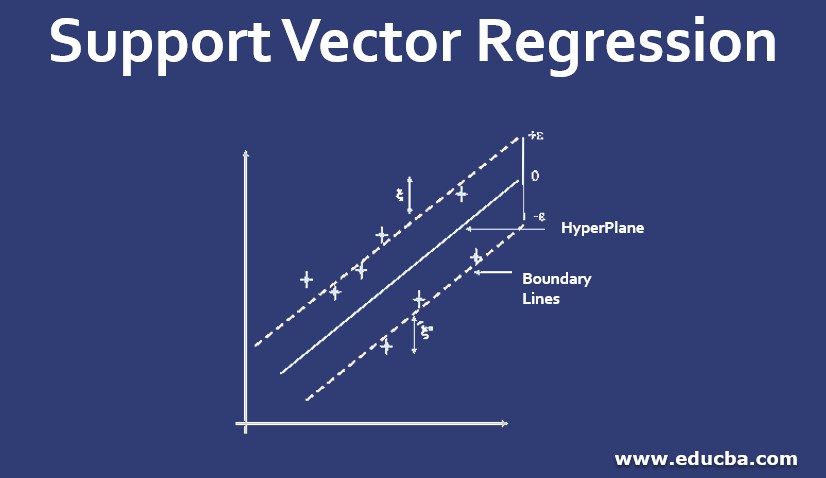
Introduction to Support Vector Regression
Support Vector Regression as the name suggests is a regression algorithm that supports both linear and non-linear regressions. This method works on the principle of the Support Vector Machine. SVR differs from SVM in the way that SVM is a classifier that is used for predicting discrete categorical labels while SVR is a regressor that is used for predicting continuous ordered variables.
In simple regression, the idea is to minimize the error rate while in SVR the idea is to fit the error inside a certain threshold which means, work of SVR is to approximate the best value within a given margin called ε- tube. Look at the figure below to understand SVR :
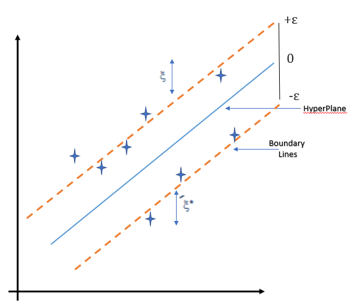
To understand the figure you need to know the following term:
1. Hyperplane: It is a separation line between two data classes in a higher dimension than the actual dimension. In SVR it is defined as the line that helps in predicting the target value.
2. Kernel: In SVR the regression is performed at a higher dimension. To do that we need a function that should map the data points into its higher dimension. This function is termed as the kernel. Type of kernel used in SVR is Sigmoidal Kernel, Polynomial Kernel, Gaussian Kernel, etc,
3. Boundary Lines: These are the two lines that are drawn around the hyperplane at a distance of ε (epsilon). It is used to create a margin between the data points.
4. Support Vector: It is the vector that is used to define the hyperplane or we can say that these are the extreme data points in the dataset which helps in defining the hyperplane. These data points lie close to the boundary.
The objective of SVR is to fit as many data points as possible without violating the margin. Note that the classification that is in SVM use of support vector was to define the hyperplane but in SVR they are used to define the linear regression.
Working of SVR
SVR works on the principle of SVM with few minor differences. Given data points, it tries to find the curve. But since it is a regression algorithm instead of using the curve as a decision boundary it uses the curve to find the match between the vector and position of the curve. Support Vectors helps in determining the closest match between the data points and the function which is used to represent them.
Following are the steps needed in the working of SVR:
- Collection of the training set
- Selection of Kernel along with its parameters and any regularization if required.
- Creation of correlation matrix
- Train machine to get the contraction coefficients α = αi
- Create an estimator using the coefficients.
1. Collection of Training Set
The training set consists of the samples that were collected on which we have to perform prediction. We need to be sure that the features of the training set should suffice the domain that we are expecting. Since the SVR is only able to interpolate between the existing data in the training dataset. Suppose, SVR Is used to estimate the cosine function then the domain on which it should be trained is: 0 → 2π If we evaluate the estimate outside the domain which we have evaluated then the result will directly depend on the choice of the kernel that is used for the SVR and the optimization routines.
2. Selection of Kernel
You can choose any kernel like Sigmoid Kernel, Polynomial Kernel, Gaussian Kernel, etc based upon the problem. All of these kernels have hyperparameters that need to be trained. In this article, I will be taking the Gaussian Kernel. Gaussian Kernel is defined as:
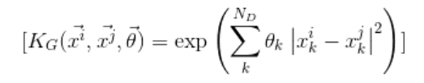
where:
- ND: is the dimension in every data point
- x and θ: are the set of hyperparameters.
Hyperparameter is selected in a way that maximizes the probability of the training set that is generated using the kernel as Bayesian prior. It is because the loss function used in the hyperparameter optimization step is the log probability of the parameters.
In SVR this training phase is the most expensive part, and lots of research are going on to develop a better way to do it. We can train it using the gradient-based optimization method like CG and minimizing the cost function.
Selection of kernel is important because if we choose a kernel like the Gaussian, which starts giving zero as the distance between the argument grows then as we start to move away from the training data, the machine will start returning the mean value of the training set. The selection of the kernel determines the estimator’s asymptotic behavior.
3. Creation of Correlation Matrix
The formation of the correlation matrix is easy to form. In this, we evaluate all the pairs of data points of the training set. After evaluating add the regularizer in the diagonal. Do so we will get a matrix:
![]()
where:
- epsilon(ε): is the regularizer
- δi,j: is the kroeniker delta function
This matrix is semidefinite and easy to use. It is used to represent the correlation matrix of the data in a higher-dimensional space than the one from which we have derived the training set.
4. Solving Matrix to Form Estimator
This is the main part while creating the SVR machine. Its plain linear algebra. Working of the machine can be described as:
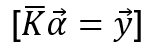
Where:
- y: vector values that correspond to the training set.
- K: correlation matrix.
- α: Unknown set that needs to be solved.
Solving α is simple as just a need to invert the correlation matrix and apply it to y. Since our correlation matrix is formed very well an efficient method to use for inversion can be QR/Cholesky.
5. Forming the Estimator
Once the value of α is known, we can easily for the estimator. Using the coefficient found at the optimization step and the gaussian kernel which we have used in this example. To estimate y* for test points (x*) compute and k and find the inner product of it with alpha vectors.
Y* = α . k
To compute the elements of using the following equation:
![]()
From the previous equation, we can figure out that if we have inverted our matrix and our regularizer is zero then the estimator perfectly passes through all of our training points. This happens because k is identical to the row in K provided the test point is in the training set. Once we have included the regularizer or got the required parameters we don’t need to recover our training set solution and they should be closed.
Advantages of SVR
- SVR is robust to the outliers.
- Decision model can be easily updated
- Can use multiple classifiers trained on the different types of data using the probability rules.
- It can improve the prediction accuracy by measuring the confidence in classification.
- SVR performs lower computation compared to other regression techniques.
- Its implementation is easy.
By now you should have a clear understanding of the Support vector regression which will help you in getting a head start for its implementation. Since Implementation is not in the scope of the article we will keep it as a separate topic in the future.
Conclusion – Support Vector Regression
In this article, we understood that SVR is one of the useful and flexible techniques. We saw how it is used for the prediction using the data points. The important thing to note is that the choice of kernel plays a crucial role in SVR modeling we have seen how the choice of kernel affects our machine. We also learned the working of SVR followed by which we saw its advantage over other regression algorithms.
Recommended Articles
This is a guide to Support Vector Regression. Here we discuss the working and the advantages of Support Vector Regression. You may also have a look at the following articles to learn more –
