Updated March 24, 2023
Introduction to Multiple Linear Regression
In machine learning Linear regression is a supervised learning algorithm that is used to predict a continuous output having a constant slope. This means that the predicted values from the linear regression will be in a specific range and it won’t try them to classify them in categories.
Linear regression is classified into two types:
- Simple Linear Regression: Only one independent variable is present.
- Multiple Linear Regression: Multiple independent variables is present.
In most of the applications, the number of features used to predict the dependent variable is more than one so in this article, we will cover multiple linear regression and will see its implementation using python.
Explanation for Multiple Linear Regression
- Multiple Linear Regression is an extension of the simple linear regression model in the way that there are multiple independent variables(features) that are used to predict the dependent variable.
- Suppose an analyst wants to know the price of the house then his linear equation will be the area of land as the independent variable and the price as the dependent variable. But in reality, more features affect the price of the house. The price of the house depends on other predictors like the floors in the house, number of bedrooms, age of the house, etc. To understand the relationship in which multiple independent variables are involved, we use multiple linear regression.
- MLR is used to determine a mathematical relationship between the multiple independent variables. Once the factor or coefficient for each independent variable is determined then the information can be used to accurately predict the outcome. The relationship created by the model is informed of a linear (straight) line that best approximates all the individual data points.
Having an idea about multiple linear regression lets us understand the maths behind it.
Equation in Multiple Linear Regression
Given below shows the equation in Multiple Linear Regression:
1. Hypothesis
The hypothesis or the model of the multiple linear regression is given by the equation:
Where,
- xi is the ith feature or the independent variables.
- θi is the weight or coefficient of ith feature.
This linear equation is used to approximate all the individual data points. If there would have been only 1 feature, then this equation would have resulted in a straight line.
2. Cost Function
Our objective is to find the optimal weight of the hypothesis so that the difference between the computed value and the actual value is minimum. This difference between the actual and computed value is termed as cost. Cost helps in determining the overall function of the model.
So, the cost of the multiple regression is given by the following equation:
Where,
- J(c): Cost Function
- m: Number of the Training Dataset
- h(θ): Hypothesis
- θ: Weights
- y: Labels
3. Gradient Descent
Next is the gradient descent, which is needed to update the weight values. The Gradient descent takes use of the partial derivative of the cost function.
Gradient descent for multiple linear regression is given by:
Where,
- ∝: Is the learning rate.
4. Normalization
It is used to speed up the computation of the gradient descent process. To do so we need to ensure that all the features are within a specific range. It is important in the dataset which has a high standard deviation or has a different range of attributes. So first we have to bring the features in the range of -1 to 1.
To perform normalization, we can use feature scaling and mean normalization. It is given by the equation:
That’s it, these are the three major steps that we need to perform while simplifying the equation to fit the parameter in the multiple linear regression.
Implementing Multiple Linear Regression
We will now see the implementation of the MLR using the scikit-learn module of python. Since it contains the optimize implementation of most of the model including the Linear Regression it is recommended to use them despite creating your own. In order to implement the code, I have used Kaggle’s workspace.
The steps involved in the implementation are:
- Import the Libraries
- Import Dataset
- Data Pre-Processing
- Splitting Data Into Test and Training Set
- Training Model
- Evaluating Model
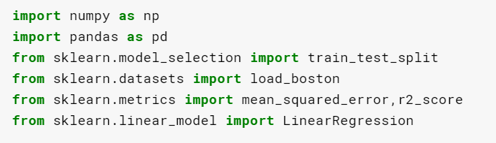
1. Import Libraries
- To implement the multiple linear regression model we will take the help of the scikit-learn module as it comes prepacked with some of the sample datasets and useful functions.
2. Import Dataset
- The next step is to import the dataset. Since scikit already has sample datasets we’ll be using the Boston Housing dataset. This dataset consists of information about the homes in Boston. The features in the dataset are used to predict the price of the house.
Let’s create the instance of the dataset and see what feature it contains:
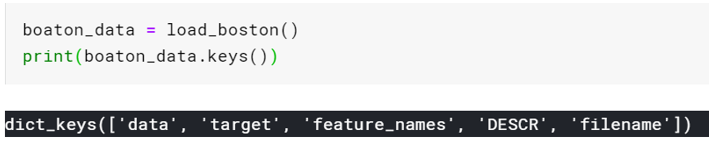
Dataset contains the following information:
- Data: The actual information on the house.
- Target: Price of the house.
- Feature names: Name of the feature of the info that the data contains.
- DESCR: It is the command used to describe the feature of the dataset.
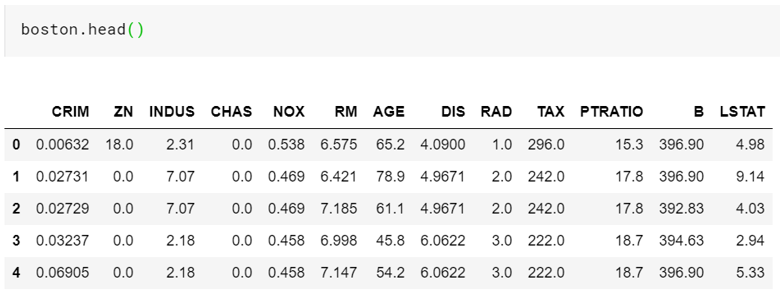
3. Data Pre-Processing
- Now will create a DataFrame object of the data, by keeping the feature name as the header, using the panda’s library.

- You can check the loaded data using the head command of the pandas.
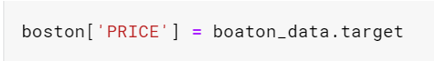
- We want to predict the price of the house but in our current data frame, we don’t have that information. So we need a new column and store the information from the dataset.
- Normally we have to perform multiple techniques of data pre-processing but that is for the other article. I will directly take the feature with stronger correlation i.e. ‘LTSAT’, and ‘RM’ (number of rooms). So, we will use these two features to perform linear regression.
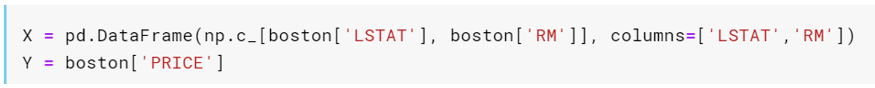
- X value will contain the independent values while the Y variable will store the target values.
4. Splitting Data Into Test and Training Set
- Now we will split the data into training and test set. Let’s keep 80% of the data for training and the remaining 20% of the data for testing.

5. Training Model
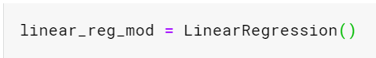
- Now we need to create the instance of the model using the scikit-Learn. We do so by simply calling the LinearRegression().
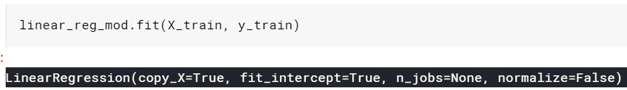
- Once the instance is created we can fit the model on the training data.
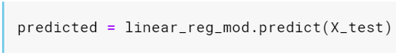
- That’s it our model has been fitted. Now we can use it to make predictions by calling the predict command. We will run the prediction on the test data.
6. Evaluating Model
- Using the RMSE and R2 metric we will compute the prediction against the actual values. RMSE and R2 are among the two popular metrics used for evaluating the regression task.
- The lower the value of rmse the better is the fit and Closer the value of R2 is to 1 then better the model fits.
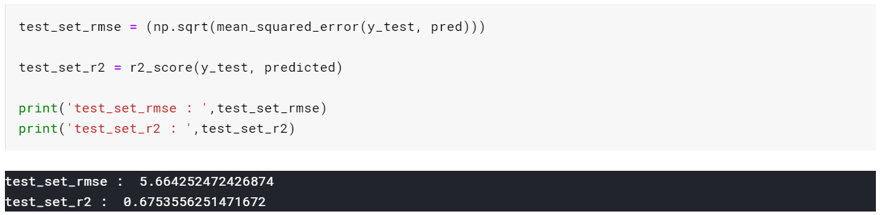
- For our model, we got the result as 5.66 and 0.67 for rmse and r2_score respectively.
- You can consider trying more features to improve the accuracy of the model.
Conclusion
In this article, we understood the Multiple linear regression along with its math and actual implementation using python. Since you have completed this article, I recommend you to try working on a different dataset and try to increase the accuracy.
Recommended Articles
This is a guide to Multiple Linear Regression. Here we discuss the explanation, with different forms of equations in multiple linear regression and examples to implement. You can also go through our other related articles to learn more –
