Updated March 6, 2023

Definition of Predictive Analysis in R
Predictive analysis is defined as a data mining area made to predict unknown future events by collecting data and performing statistics and deployment processes. R is a statistical Programming language that helps in a great way to work with data. Predictive analytic is applied to any type of information whether be in the past or future. It takes up new data to re-predict the values, therefore, improving prediction accuracy and helps in solving business problems.
Syntax:
The general syntax in R is
forecast = predict(model,value)
How to Perform Predictive Analysis in R?
Here we shall discuss the working process of Predictive analysis step-wise. More specifically we introduced the concept of linear and logistic regression of data science background. The purpose of this article is to use Data Science in R working Environment as it has good packages written and comes up with concrete results. Linear Regression is the most commonly used algorithm for predictive modeling.
Realtime Example:
With the number of COVID cases increases in India, the predictive model helps to predict the number of cases weekly/daily basis and tends to find out when the virus increases high and drops down and other related pieces of information are also seen.
In this section, we will use a women dataset that predicts women’s weight from the metrics based on the number of observed value variants and experimented using Rstudio. The data are stored in a separate CSV file for the first example.
Predictive analysis is performed in two phases:
- Building a model
- Real-time prediction
The following packages and libraries are used in the below examples.
- datasets: Used for training data. R consists of a wide variety of data sets to work on. Where it maintains a repository of machine learning datasets to build a predictive model. The next step is to prepare data for a collection and to plot these values.
- ggplot2: It’s a Package used to build plots for our application.
- GGally: Used to create a plot matrix for the data visualization.
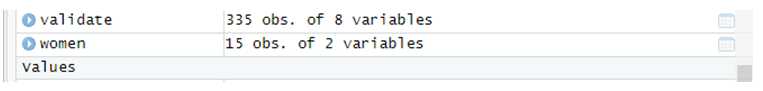
Step-1: Creating a data set for women and it has two variables. This metrics is used for future events to study the women’s details. Here measuring women’s weight is a lot harder.
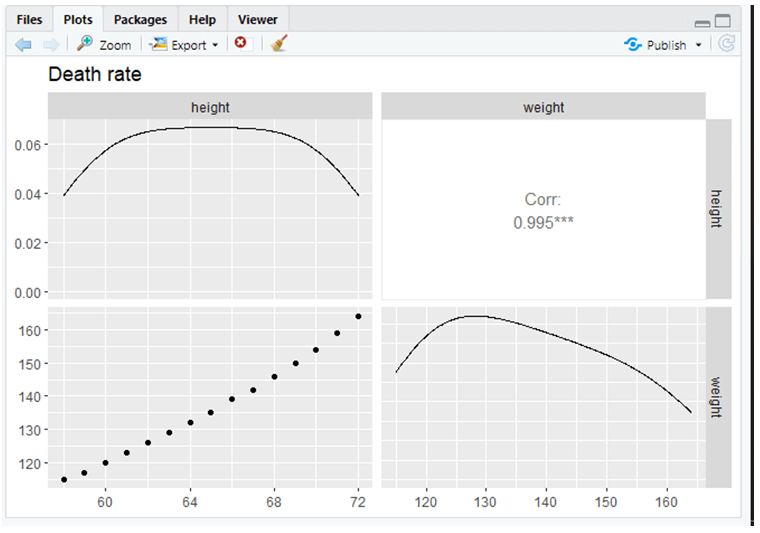
Next, to do the exploratory analysis we will be using GGally packages to see how the variables are related to each other with the response variable. The correlation coefficients are monitored closely, If it is closer to 1 the relationship between the variables is stronger.
Step-2: Building Linear Regression Using lm() function which fits all possible 15 Observations. It should satisfy minimize least squares. The distance is calculated to find the residuals. The equation can be calculated as
Women weight ≈ Intercept + Slope(women height) + Error
The output of the model which is done so far is given with a summary (). The summary gives a detailed look into coefficients, variables and other levels of data.
Examples of Predictive Analysis in R
Implementation using Rstudio taken the data women.
Example #1
library(GGally)
data(women)
head(women)
height weight
1 58 115
2 59 117
3 60 120
4 61 123
5 62 126
6 63 129
> ggpairs(data=women, columns=1:2, title="Death rate")
fit_ex <- lm(height ~ weight, data = women)
ggplot(data=women, aes(fit_ex$residuals)) +
geom_histogram(binwidth = 1, color = "green", fill = "yellow") +
theme(panel.background = element_rect(fill = "red"),
axis.line.x=element_line(),
axis.line.y=element_line()) +
ggtitle("Histogram for women height")
> ggplot(data = women, aes(x = height, y = weight)) +
geom_point() +
stat_smooth(method = "lm", col = "blue") +
theme(panel.background = element_rect(fill = "grey"),
axis.line.x=element_line(),
axis.line.y=element_line()) +
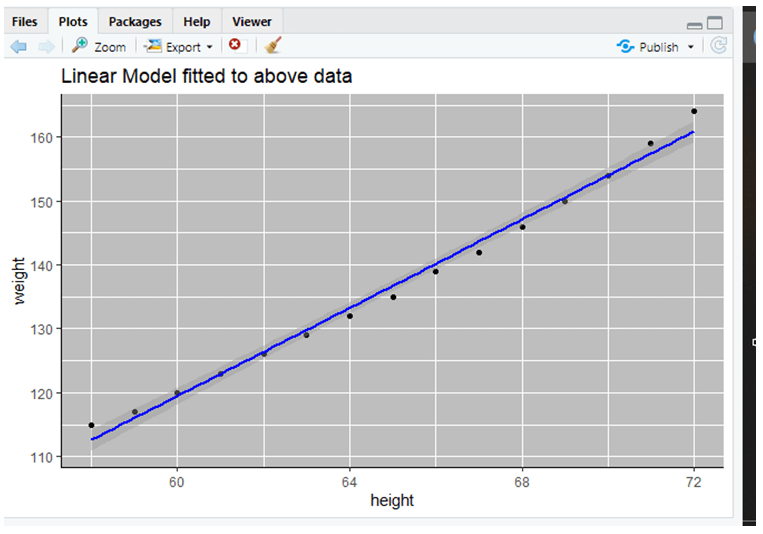
ggtitle("Linear Model fitted to above data")
>predict(fit_ex, data.frame(weight = 70.2))
1
45.88835
Output:
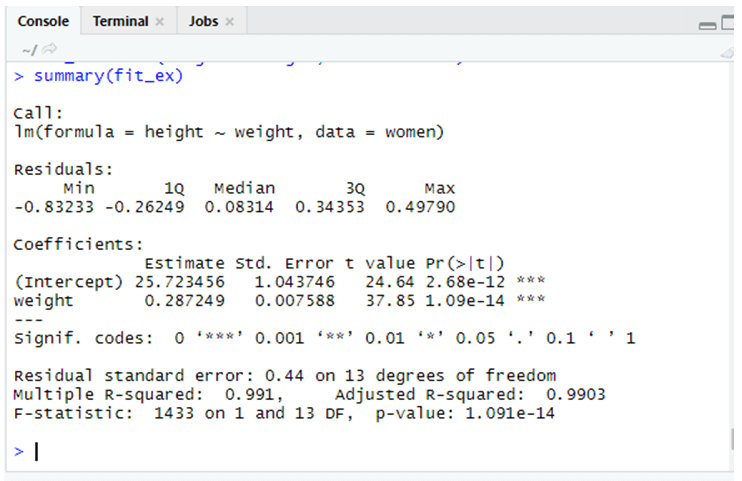
The output here shows coefficients and residuals values. The intercept value in our example is not with a negative value. It shows overall a positive value means that the predictions get increased as there is an increase in a true value. This is our expected women’s height. In the below graph we could see that for an additional inch of height the weight increases by 0.2.
Output:
The Visualizations are shown below a few plots are obtained using ggplot2
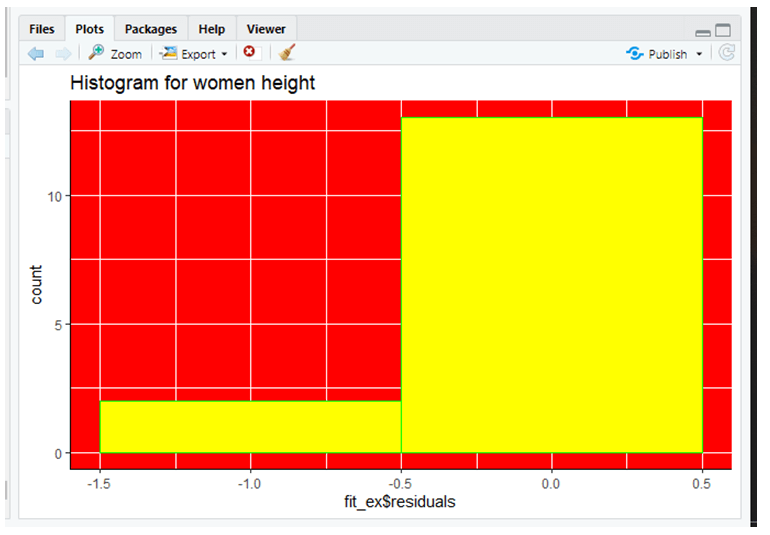
The Histogram bar chart compares height and weight with the residuals. It shows the average height of women.
Here we shall have a look at the model which fits the data for weight and height. This can be done by using ggplot function to do a scatter plot of the given data. So here is the plot yielded in RStudio using the function:
Finally, to make predictions we can use predict () a model fitting functions. Here Our predicted weight value is 50. But the result in the code gives 45kg which is closer to 50kg.
Example #2
Code:
x <- c(680, 8713, 18166, 64287, 71600,
98521, 65324, 152114, 115843,
531267, 896851, 208725, 3072113)
> library(lubridate)
Attaching package: ‘lubridate’
The following object is masked from ‘package:base’:
date
> library(forecast)
Registered S3 method overwritten by 'quantmod':
method from
as.zoo.data.frame zoo
This is forecast 8.14
Stackoverflow is a great place to get help on R issues:
http://stackoverflow.com/tags/forecasting+r.
Warning message:
package ‘forecast’ was built under R version 3.6.3
> cts <- ts(x, start = decimal_date(ymd("2021-02-21")),
+ frequency = 365.25 / 6)
> fit <- auto.arima(cts)
> forecast(fit, 4)
Point Forecast Lo 80 Hi 80 Lo 95 Hi 95
2021.353 3072113 1962765.8 4181460 1375512.9 4768713
2021.370 3072113 1503259.2 4640967 672758.1 5471468
2021.386 3072113 1150667.3 4993559 133515.4 6010711
2021.403 3072113 853418.6 5290807 -321087.2 6465313
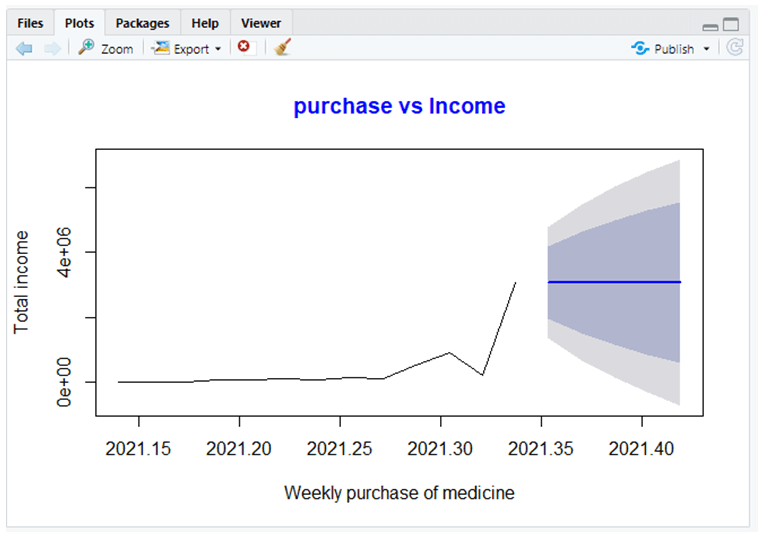
> plot(forecast(fit, 5), xlab ="Weekly purchase of medicine",
+ ylab ="Total income",
+ main ="purchase vs Income", col.main ="blue")
Explanation: In the above R code, we have taken historical data and created a time series for the date format and created a plot to show purchase data report for the year 2022 and the forecasting result is given as:
Output:
Conclusion
As we have seen Predictive analysis implementation in R with an example. Predictive analysis is used in applications like financial services, marketing, and telecommunications. Finally, this article shows you how to generate a dataset from the R libraries and analyze the future prediction using Linear regression and some random values. This model reduces risks and increases the organizations’ sales revenue with huge amounts of data.
Recommended Articles
This is a guide to Predictive Analysis in R. Here we also discuss the definition and how to perform predictive analysis in R? along with examples. You may also have a look at the following articles to learn more –
