EDUCBA

EDUCBA

MENUMENU
  • Free Tutorials
  • Certification Courses
  • 120+ Courses All in One Bundle
  • Login

Excel Stacked Bar Chart

By Madhuri ThakurMadhuri Thakur

Home » Excel » Blog » Excel Charts » Excel Stacked Bar Chart

Stacked Bar Chart in Excel

Excel Stacked Bar Chart (Table of Contents)

  • Stacked Bar Chart in Excel
  • How to Create a Stacked Bar Chart in Excel?

Stacked Bar Chart in Excel

A stacked bar chart is a type of bar chart used in excel for the graphical representation of part-to-whole comparison over time. This helps you to represent data in a stacked manner. This type of graph is suitable for data that is represented in different parts and one as a whole. The gradual variation of different variables can be picturized using this.

Start Your Free Excel Course

Excel functions, formula, charts, formatting creating excel dashboard & others

The stacked bar graph can be implemented in 2D or 3D format. From the Insert menu, the chart option will provide different types of charts. The stacked bar chart comes under the bar chart. Two types of stacked bar charts are available. Stacked bar chart and 100% stacked bar chart. The stacked bar chart represents the given data directly, but a 100% stacked bar chart will represent the given data as the percentage of data that contribute to a total volume in a different category.

A variety of bar charts are available, and according to the data you want to represent, the suitable one can be selected. 2D and 3D stacked bar charts are given below. The 100% stacked bar chart is also available in 2D and 3D style.

How to Create a Stacked Bar Chart in Excel?

The stacked Bar Chart in Excel is very simple and easy to create. Let us now see how to create a Stacked Bar Chart in Excel with the help of some examples.

You can download this Stacked Bar Chart Excel Template here – Stacked Bar Chart Excel Template

Example #1 –  Stacked Chart Displayed Graphically

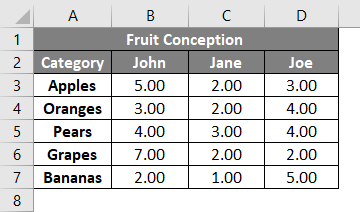
A dietitian gives fruit conception of three different patients. Different fruits and their conception are given. Since the data consist of three different persons and five different fruits, a stacked bar chart will be suitable to represent the data. Let’s see how this can be graphically represented as a stacked bar chart.

  • John, Joe, Jane are the 3 different patients, and the fruits conception are given as below.

Fruit Conception

  • Select the column Category and 3 patient’s quantity of conception. Select Insert from the menu.

Insert Option

  • Select the See All Charts option and get more charts types. Click on the small down arrow icon.

See All Charts option

  • You will get a new window to select the type of graph. The recommended charts and All Charts tab will be shown. Click on the All Charts tab.
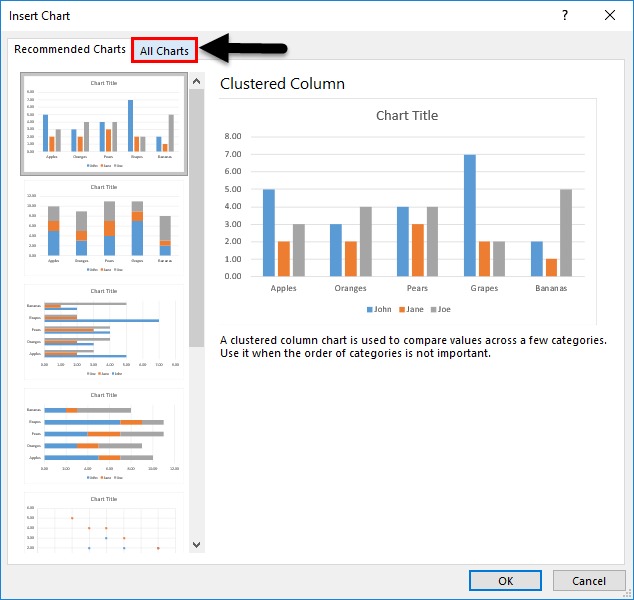
All chart tab

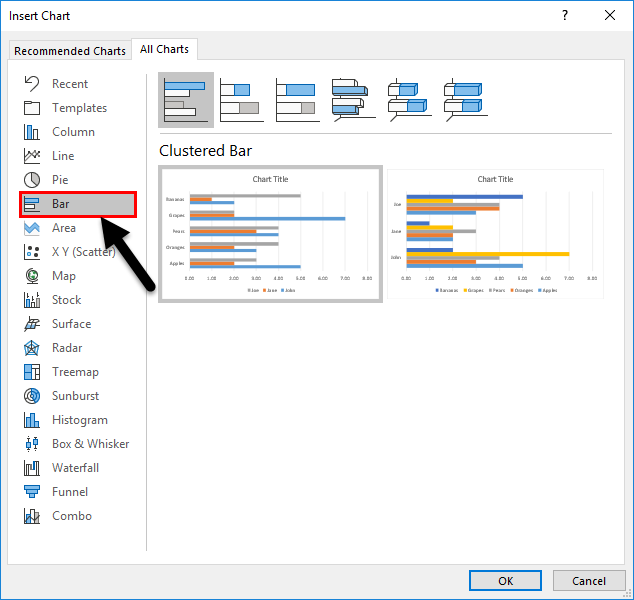
  • You can see a different type of graph is listed below it. Select the Bar graph since we are going to create a stacked bar chart.

Bar Graph

  • Different bar charts will be listed. Select the Stacked Bar graph from the list.

Stacked Bar graph

  • Below are the two format styles for the stacked bar chart. Click on any one of the given styles. Here we have selected the first one and then press the OK button.

Stacked Bar Chart

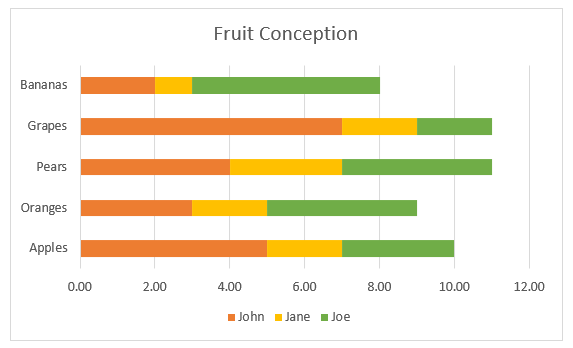
  • The graph will be inserted into the worksheet. And it is given below.
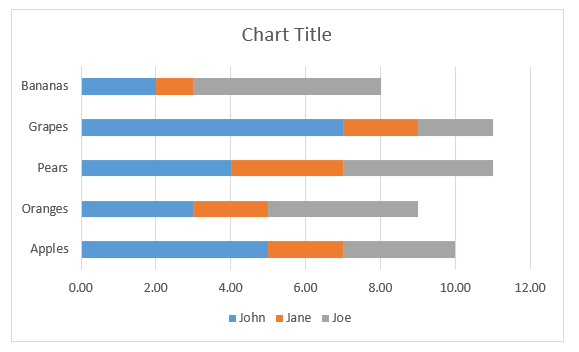
Result of Example 1

  • For more settings, you can press the “+” symbol right next to the chart. You can insert the axis name, heading, change color, etc.
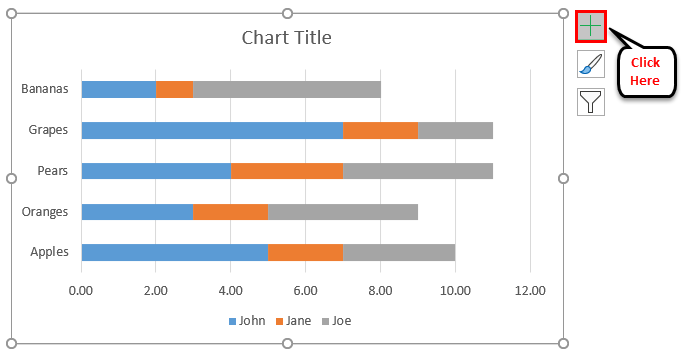
Editing with plus sign

  • The chart will finally look as below.

Final Result

Three different colors represent three persons. The bar next to each fruit shows its conception by different patients. From the graph, it is easy to find who used a particular fruit more, who consumes more fruits, which fruit consumes more apart from the given five.

Example #2 – Create 3-D Stacked Bar Chart

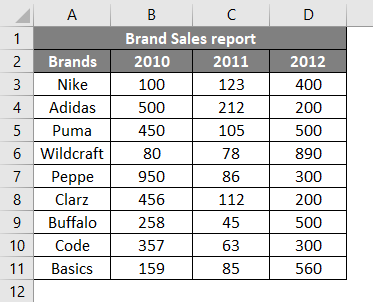
Sales report of different brands is given. Brand names and sales are done for 3 years 2010, 2011, 2012. Let’s try to create a 3-D stacked bar chart using this.

  • Sales done for different brands and years are given as below.

Brand Sales Report

  • Select the data and go to the chart option from the Insert menu. Click on the bar chart select a 3-D Stacked Bar chart from the given styles.
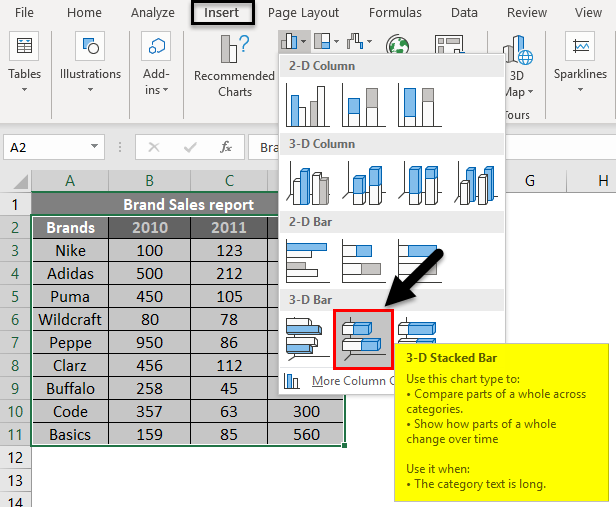
3-D stacked bar chart

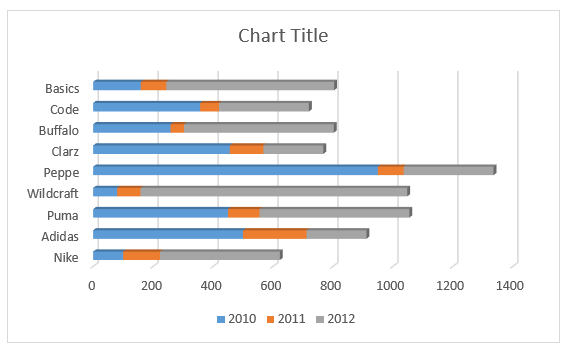
  • The chart will be inserted for the selected data as below.

Result

  • By clicking on the title, you can change the tile.
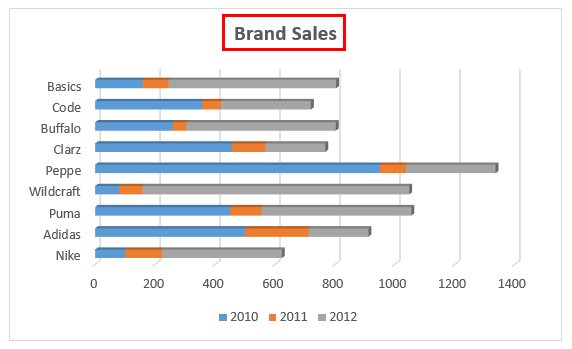
Brand Sales Title

  • Extra settings to change the color and X, Y-axis names, etc.
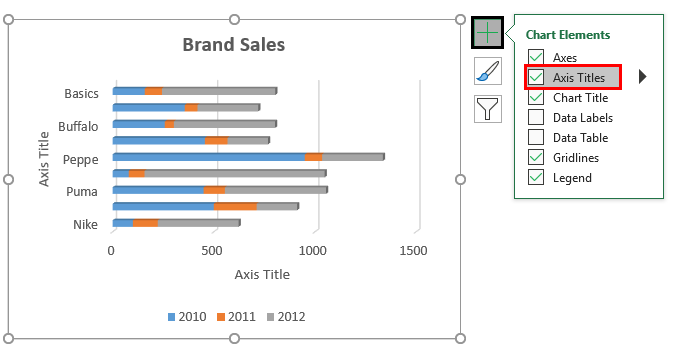
  • The axis name can be set by clicking on the “+” symbol and select Axis Titles.

Axis Title

  • The chart for the sales report will finally look as below.
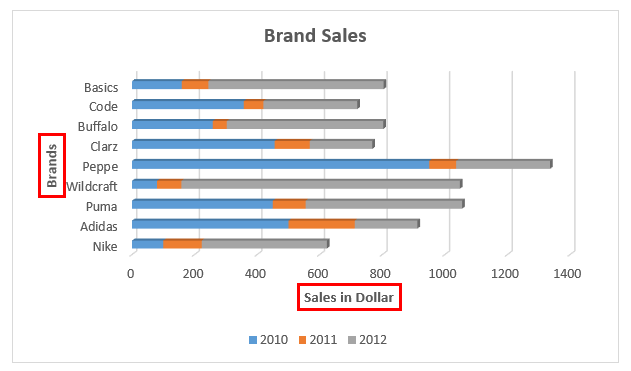
Final Result

The sales in different years are shown in 3 different colors. The bar corresponding to each brand shows sales done for a particular one.

Example #3 – Create 100% Stacked Bar Chart

In this example, we are trying to graphically represent the same data given above in a 3-D stacked bar chart.

Popular Course in this category
Sale
Excel Advanced Training (16 Courses, 23+ Projects)16 Online Courses | 23 Hands-on Projects | 140+ Hours | Verifiable Certificate of Completion | Lifetime Access
4.8 (10,659 ratings)
Course Price

View Course

Related Courses
Excel Data Analysis Training (15 Courses, 8+ Projects)Excel for Marketing Training (8 Courses, 13+ Projects)
  • The data table looks as below with brand names and sales done for different periods.

Create 100% Stacked Bar Chart

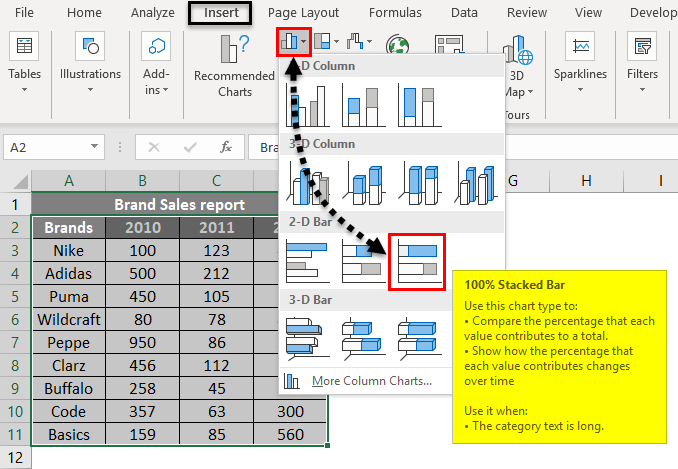
  • By selecting the cell from B2: E11, go to the Insert menu. Click on the Chart option. From Bar Charts, select the 100% Stacked Bar Chart from 2-D or 3-D style. Here we selected form 2-D style.

100% Stacked Bar Chart

  • The graph will be inserted into the worksheet. And it is given below.

Result

  • The color variations can also be set by right-clicking on the inserted graph. The color fill options will be available. The final output will be as below.

Final Result of Example 3

The Y-axis values are given in percentage. And the values are represented in a percentage of 100 as a cumulative.

Things to Remember About Stacked Bar Chart in Excel

  • The data given as different parts and cumulated volume can be easily represented using a stacked bar chart.
  • Multiple data of gradual variation of data for a single variable can effectively visualize by this type of graphs.
  • Stacked bar charts are helpful when you want to compare total and one part as well.
  • According to the data set, select the suitable graph type.

Recommended Articles

This has been a guide to Stacked Bar Chart in Excel. Here we discuss how to create a Stacked Bar Chart in excel along with excel examples and a downloadable excel template. You may also look at these suggested articles –

  1. Excel Stacked Column Chart
  2. Excel Stacked Area Chart
  3. Excel Clustered Bar Chart
  4. Grouped Bar Chart

All in One Excel VBA Bundle (120+ Courses, 30+ Projects)

120+ Online Courses

30+ Projects

500+ Hours

Verifiable Certificates

Lifetime Access

Learn More

2 Shares
Share
Tweet
Share
Primary Sidebar
Excel Functions
  • Excel Charts
    • Excel Data Visualization
    • Dashboard in Excel
    • Bullet Chart in Excel
    • Excel Animation Chart
    • Plots in Excel  
    • Interactive Chart in Excel
    • Surface Charts in Excel
    • Excel Calendar Template
    • Thermometer Chart in Excel
    • Box Plot in Excel
    • S CURVE in Excel
    • Venn Diagram in Excel
    • Project Management with Gantt Chart
    • Change Chart Style in Excel
    • 3D Scatter Plot in Excel
    • Box and Whisker Plot in Excel
    • Radar Chart in Excel
    • Control Charts in Excel
    • Dot Plots in Excel
    • Marimekko Chart Excel
    • Combo Chart in Excel
    • Contour Plots in Excel
    • Candlestick Chart in Excel
    • Map Chart in Excel
    • Pie Chart Examples
    • Excel Stacked Bar Chart
    • Excel Flowchart
    • Excel Types of Graphs
    • Excel Normal Distribution Graph
    • Excel Bell Curve
    • Legends in Excel Chart
    • Excel Chart Templates
    • Excel Organization Chart
    • Excel Doughnut chart
    • Excel 3D Plot
    • Excel Scatter Chart
    • Excel Line Chart
    • Excel Combination Charts
    • Excel Gauge Chart
    • Excel Pivot Chart
    • Excel Clustered Column Chart
    • Excel Dynamic Chart
    • Excel Stacked Column Chart
    • Excel Bubble Chart
    • Histogram Chart Excel
    • Excel Gantt Chart
    • Excel Stacked Area Chart
    • Excel Waterfall Chart
    • Excel Area Chart
    • Excel Clustered Bar Chart
    • Excel Column Chart
    • Excel Pie Chart
    • Comparison Chart in Excel
    • Pareto Analysis in Excel
    • Add a Secondary Axis in Excel
    • Grouped Bar Chart
  • Excel Functions (12+)
  • Excel Tools (114+)
  • Financial Functions in Excel (17+)
  • Logical Functions in Excel (14+)
  • Lookup Reference Functions in Excel (34+)
  • Maths Function in Excel (47+)
  • TEXT and String Functions in Excel (26+)
  • Date and Time Function in Excel (23+)
  • Statistical Functions in Excel (58+)
  • Information Functions in Excel (4+)
  • Excel Tips (222+)
  • Workplace Productivity (4+)
  • Microsoft Office Tools (15+)
  • Excel Formula and Functions (21+)
  • MS Excel Shortcuts (4+)
Excel Functions Courses
  • EXCEL ADVANCED COURSE
  • Excel Data Analysis Course
  • Excel for Marketing Course
Footer
About Us
  • Blog
  • Who is EDUCBA?
  • Sign Up
  • Live Classes
  • Corporate Training
  • Certificate from Top Institutions
  • Contact Us
  • Verifiable Certificate
  • Reviews
  • Terms and Conditions
  • Privacy Policy
  •  
Apps
  • iPhone & iPad
  • Android
Resources
  • Free Courses
  • Excel Charts
  • Excel Tips
  • All Tutorials
Certification Courses
  • All Courses
  • Excel VBA Course - All in One Bundle
  • VBA Course
  • Excel Data Analysis Course
  • Excel for Marketing Course
  • Excel for Finance Course
  • Excel for HR Training

© 2022 - EDUCBA. ALL RIGHTS RESERVED. THE CERTIFICATION NAMES ARE THE TRADEMARKS OF THEIR RESPECTIVE OWNERS.

EDUCBA
Free Excel Course

Excel functions, formula, charts, formatting creating excel dashboard & others

*Please provide your correct email id. Login details for this Free course will be emailed to you

By signing up, you agree to our Terms of Use and Privacy Policy.

EDUCBA
Free Excel Course

Excel functions, formula, charts, formatting creating excel dashboard & others

*Please provide your correct email id. Login details for this Free course will be emailed to you

By signing up, you agree to our Terms of Use and Privacy Policy.

Let’s Get Started

By signing up, you agree to our Terms of Use and Privacy Policy.

Loading . . .
Quiz
Question:

Answer:

Quiz Result
Total QuestionsCorrect AnswersWrong AnswersPercentage

Explore 1000+ varieties of Mock tests View more

EDUCBA Login

Forgot Password?

By signing up, you agree to our Terms of Use and Privacy Policy.

This website or its third-party tools use cookies, which are necessary to its functioning and required to achieve the purposes illustrated in the cookie policy. By closing this banner, scrolling this page, clicking a link or continuing to browse otherwise, you agree to our Privacy Policy

EDUCBA

Download Stacked Bar Chart Excel Template

EDUCBA

*Please provide your correct email id. Login details for this Free course will be emailed to you

By signing up, you agree to our Terms of Use and Privacy Policy.

Special Offer - EXCEL ADVANCED COURSE Learn More