Updated June 15, 2023
Difference Between Splunk vs Nagios
What is Splunk?
Splunk is a tool to analyze, search and visualize machine data. Today, with the increasing popularity of the internet, IoT devices, wearable devices, and a multi-fold increase in computation and processing power, the generation of machine data has increased exponentially. Such a huge amount of machine data contains powerful insights which might have tremendous value.
Founded in 2003, Splunk offers its products across three primary categories, Splunk Enterprise, Splunk Light, and Splunk Cloud.
The primary purpose of Splunk is to collect and analyze a high volume of machine data (big data) and identify data patterns, provide metrics, diagnose problems, and provide intelligence for operation teams. Splunk provides API to connect with various types of systems and applications directly. The biggest selling point of Splunk is that it works in real time.
Splunk Architecture

Data Input Stage: In this stage, Splunk consumes raw data from a source system. Splunk breaks down the data stream into 64K blocks and annotates each block with metadata keys.
Data Storage Stage: This stage consists of two parts- Parsing and Indexing. Parsing extracts important information from data by breaking the data stream into individual events. In the indexing phase, parsed events are written to the disk index. Indexing helps during the searching stage.
Data Storage Stage: In this stage, Splunk provides search results based on user-created search criteria, as mentioned above.
Splunk has an important feature called a knowledge object. These knowledge objects monitor events and give notifications when certain conditions occur. These results can be collected and visualized by creating reports and time charts.
Splunk can be configured to use IoT data. For example, Splunk may get data from wearable devices using IoT technologies to monitor patients’ health parameters and send notifications regarding critical changes in conditions to doctors and patients. Thus, it can report health conditions in real-time, delve deeper into patients’ health records, analyze them, and generate period or need-based alerts to concerned persons.
What is Nagios?
Nagios is a monitoring tool that continuously monitors system infrastructures like servers etc, to ensure all critical components i.e. systems, applications, services, and business processes, are functioning properly.
Nagios Architecture
Nagios runs on a server as a daemon or service. It follows a server/agent architecture, where it runs on a host, and plugins are used to interact with both local and remote hosts that need to be monitored. The Plugins send information to the scheduler, which displays it on a GUI for the user to view the status and take action.
An important component of Nagios is NRPE (Nagios remote plugin executor). Its advantage is that it allows monitoring of local resources, like CPU load, memory usage, etc., from remote machines as well. To enable monitoring from remote systems, an agent like NRPE must be installed, as the resources are not exposed to external machines.
There are other types of Nagios agents as well as NRDP, NSClient++, NCPA, etc. A more advanced version of Nagios is Nagios XI. It offers major functionality enhancement over Nagios core, e.g. extensive user interface, configuration editor, advanced reporting, monitoring wizards, an extensible front-end and back-end, etc.
Head to Head Comparison Between Splunk vs Nagios (Infographics)
Below is the Top 7 comparison between Splunk vs Nagios:
Why are we comparing?
A comparison of Splunk and Nagios makes sense as both Splunk and Nagios do the same/similar task up to an extent. Both Splunk and Nagios are tools to study the health of system infrastructure. While each has a distinct way of working and different architecture, there are some areas where they overlap. The comparison also makes sense as Nagios is open source while Splunk is propriety.
Key Differences Between Splunk and Nagios
Below are the lists of points that describe the key differences between Splunk and Nagios:
- Nagios has a better alert mechanism than Splunk.
- Using Nagios, you can handle the acknowledgment of alerts and configure alerts to be sent at specific times, such as between 9 am to 6 pm. Splunk does not offer this functionality.
- Splunk is user-friendly, as detailed documentation is available.
- Splunk is much better compared to Nagios when dashboard features are concerned.
- Nagios is free.
- Splunk and Nagios rather complement each other than compete against each other. However, there are a few areas of overlap.
- While mid and larger-sized organizations generally prefer to use Splunk, freelancers, small companies, and start-ups often choose to use Nagios.
- Both Nagios and Splunk come with web-based interfaces for user interactions.
Splunk vs Nagios Comparison Table
Following is the comparison table Between Splunk and Nagios.
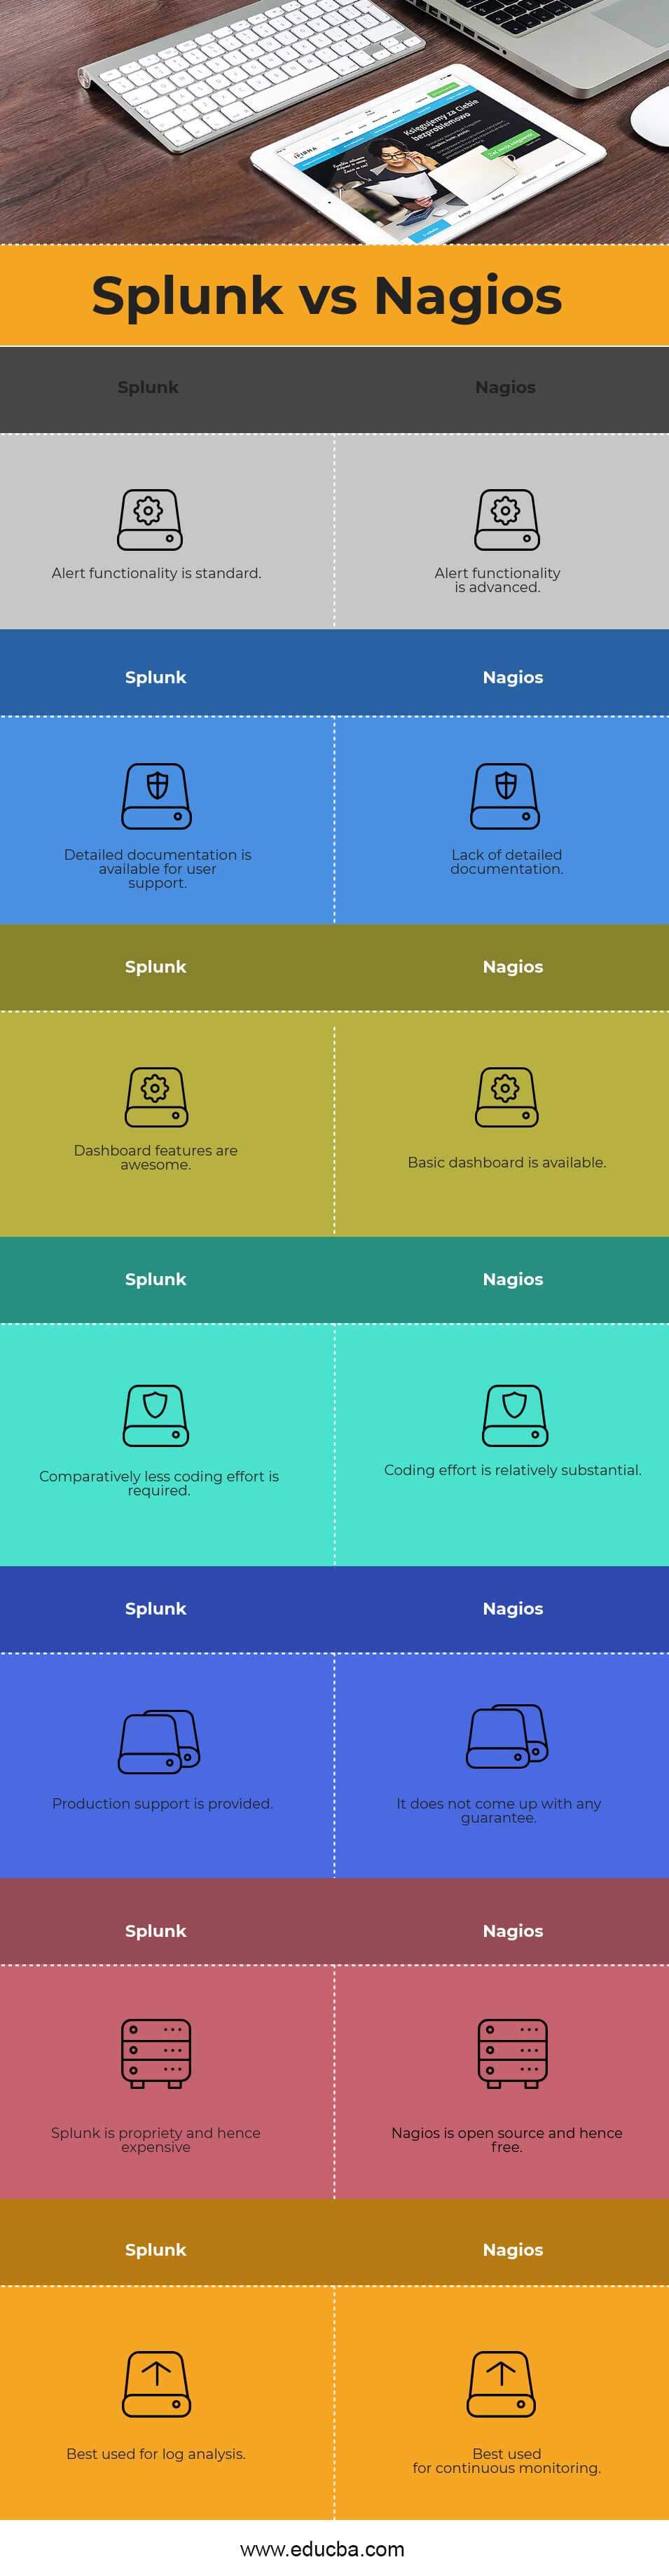
| Splunk | Nagios |
| Alert functionality is standard | Alert functionality is advanced |
| Detailed documentation is available for user support | Lack of detailed documentation |
| Dashboard features are awesome | The basic dashboard is available |
| Comparatively, less coding effort is required | Coding effort is relatively substantial |
| Production support is provided | It does not come up with any guarantee |
| Splunk is propriety and hence expensive | Nagios is open source and hence free |
| Best used for log analysis | Best used for continuous monitoring |
Conclusion
In this Splunk and Nagios post, we read about the Differences Between Splunk vs Nagios. Hope you liked the post.
Recommended Articles
We hope that this EDUCBA information on “ReactJs Interview Questions” was beneficial to you. You can view EDUCBA’s recommended articles for more information.
