Updated May 5, 2023
Differences Between Splunk vs Tableau
With the ever-increasing data flow in a market, it becomes essential for most corporations today to use the right business intelligence software. The definition of “right” is not related to choosing the one with many features but the one capable of addressing all your crucial priorities. Business intelligence software is an application designed to extract, analyze, and transform data as needed and report for business intelligence purposes. The data is generally previously stored, though applications like Apache Spark provide real-time data streaming capabilities, specifically using meta keywords in a data warehouse.
Let us understand the role of business intelligence with the help of an example.
Suppose you are required to predict the team that will win the ICC Cricket world cup this year, then you would need the performance statistics of all the players for the past 10 years and other stakeholder details. That data can be stored in a NoSQL database or an RDBMS. Then this data can be extracted, transformed, and provided to Business intelligence tools using Hadoop software. Now, these tools can predict the winning team by looking at the winning trend and the correct set of parameters, such as the coach under whom the groups most likely won, etc.
Two such tools are Splunk and Tableau, which can give your business an additional edge over your competitors. Let’s find out in this Tableau vs. Splunk post, using comparison, the right-suited tool for your needs.
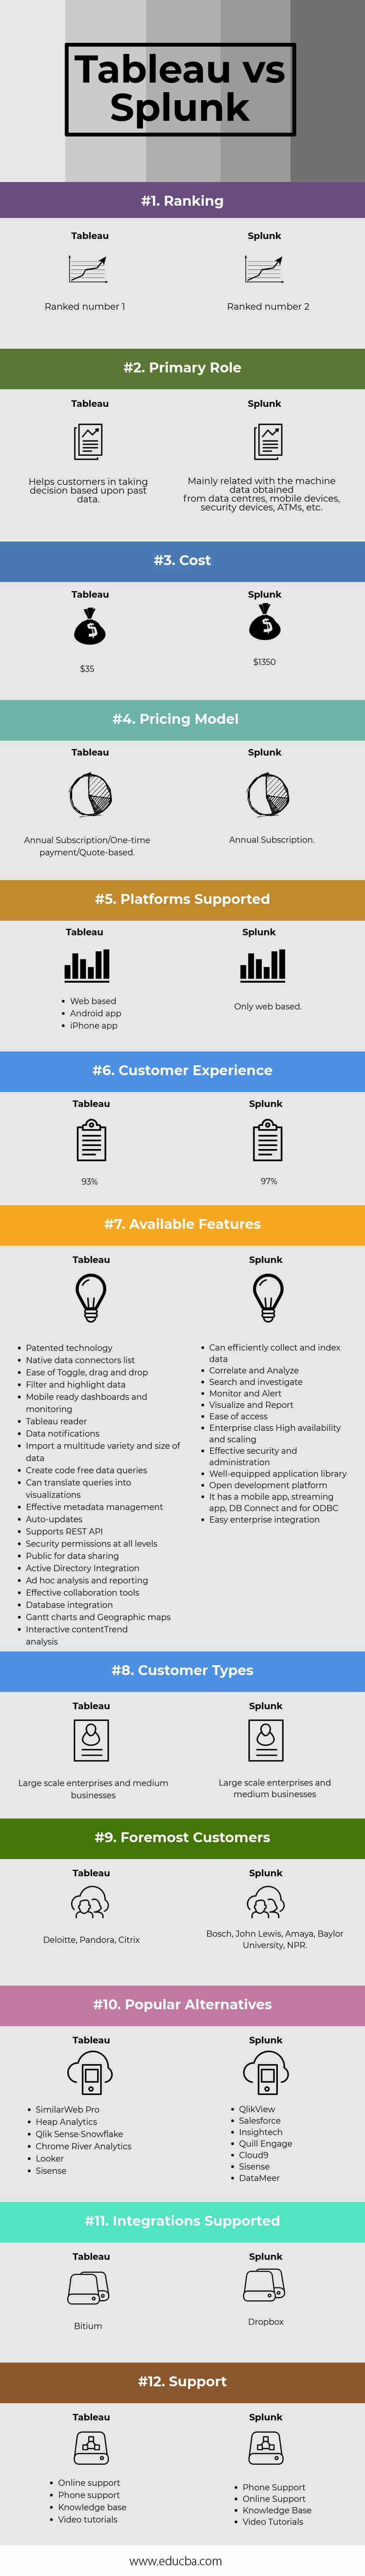
Head to Head Comparison Between Splunk and Tableau (Infographics)
Below is the top 12 comparison between Splunk and Tableau:
Key Differences Between Splunk and Tableau
The differences between Splunk and Tableau are explained in the points presented below:
- Splunk monitors all machine activities, including logins and actions taken on those machines under each user. In contrast, Tableau provides pattern-based visualizations under a massive pile of data on a real-time basis.
- Splunk is mainly compared with QRadar from IBM, Micro Focus ArcSight, and LogRhythm, whereas Tableau can be compared with Microsoft BI, Oracle OBIEE, and SAS Visual Analytics.
- Splunk helps organizations by reducing MTTR, as all the developers and stakeholders have easy access to log events. It reduces costs by eliminating the need to engage developers of multiple teams for issues relating to various platforms. It also provides an improved security mechanism, as many people cannot access servers. Conversely, Tableau is intuitive and straightforward in creating insights, and its drag-and-drop feature makes it extremely handy to use. It is also capable of handling quick calculations by providing various shortcuts. It provides a wide variety of data connector integration with different databases.
- As far as initial setup and implementation are concerned, Splunk provides a relatively straightforward design. An experienced implementation partner could be considered for this purpose. Implementing Tableau is much simpler and is just a matter of hours.
- Splunk enterprise becomes extremely costly after a 20GB/month license when discussing pricing, cost, and licensing. So, if you manage and watch your logging (by not logging excessive event triggers), this number is a long way to go. Tableau is very useful for small-scale organizations as it is relatively cheaper but becomes costly with the increase in server integrations.
- There is room for improvement for both Splunk and Tableau. Splunk certifications such as CBT are comparatively expensive, so only some people can certify themselves and, therefore, cannot utilize the tool optimally. Managing and filtering logs becomes a significant task as easy data ingestion can result in exceeded bandwidth. A suggested easier way is to provide the functionality to flag the non-critical files so that they can be discarded on their own by the tool. When it comes to Tableau lacks machine learning and other cognitive data science technologies, due to which implementation of new analytics languages, such as R, SAS, Python, etc., is not possible. Also, techniques like decision trees, CHAID analysis, and K-means cannot be implemented due to the lack of cognitive technologies. Tableau has a connector to R, which can be used with minimal features.
- We advise using Splunk to let an experienced Splunk architect design the infrastructure configuration by collaborating entirely with the senior technical team to understand product viability. Splunk configurations should be managed in GIT, and team members should be educated as quickly as possible to use the tool efficiently. For Tableau, only 2M data points should be visualized instantly, and extracted data should be used for high performance. Using just 3-4 sections in the report and doing calculations during the ETL phase will reap the maximum benefit from this tool.
Comparison Table Between Splunk vs Tableau
Below are the lists of points that describe the comparisons between Splunk and Tableau.
| Basis of Comparison | Tableau | Splunk |
| Ranking | Ranked number 1 | Ranked number 2 |
| Primary Role | Helps customers in taking decision-based upon past data | Mainly related to the machine data obtained from data centers, mobile devices, security devices, ATMs, etc. |
| Cost | $35 | $1350 |
| Pricing Model | Annual Subscription/One-time payment/Quote-based | Annual Subscription |
| Platforms Supported |
|
Only web-based |
| Customer Experience | 93% | 97% |
| Available Features |
|
|
| Customer Types | Large-scale enterprises and medium businesses | Large-scale enterprises and medium businesses |
| Foremost Customers | Deloitte, Pandora, Citrix | Bosch, John Lewis, Amaya, Baylor University, NPR |
| Popular Alternatives |
|
|
| Integrations Supported | Bitium | Dropbox |
| Support |
|
|
Conclusion
In this Splunk vs Tableau post, we made a detailed comparison between Splunk and Tableau. There are other tools in the market that can suit your need better. Go ahead, implement these tools in your business, and write back to us about your thrilling experience with these tools.
Recommended Articles
We hope that this EDUCBA information on “Splunk vs Tableau” was beneficial to you. You can view EDUCBA’s recommended articles for more information.
