Updated May 4, 2023
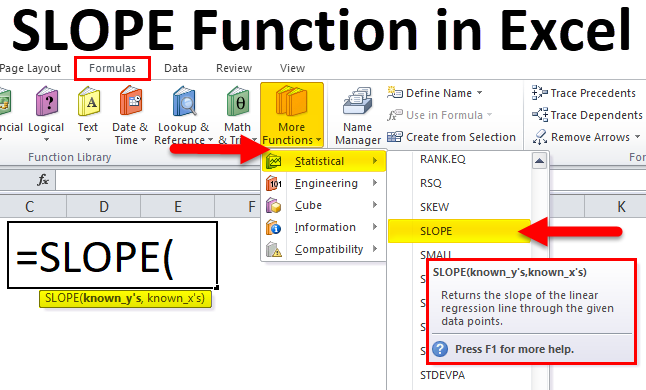
SLOPE Function in Excel
SLOPE Function is a statistical function in Excel. SLOPE Function calculates the slope of a line generated by linear regression. In Excel, Slope is calculated by considering the data points on a straight line called Known Xs and Known Ys. A straight line equation is formed by using Slope and Intercept, where Slope is the ratio of rise and run, which are anywhere in the straight line. For example, we have created a straight line using some values, and we need to find the Slope of that using a few or all the used values; this is done using the Slope function.
Before going to a brief introduction on the SLOPE Function in Excel, let us discuss what SLOPE is?
What is the SLOPE of a Line?
The slope of a line is nothing but the Steepness of the line. The slope of a straight line shows how steep the line is. “The steeper the line, the larger the slope”.
Now, look at the below lines.

Each of the above lines represents the money in the bank account over a period.
Line 1: This line is going up. That means the amount of money in this bank account increases over time.
Line 2: This line is going down. That means the amount of money in this bank account decreases over time.
Line 3: This horizontal straight line neither goes up nor comes down. This is a steady line, and the amount of money remains constant.
Line 4: This line is also going up like the first line. But this line seems to be going up faster than the first line. This line looks steeper than the first one. This bank account’s money is increasing faster because of the steeper line.
What if we want to be specific about how we describe this steepness. SLOPE is described as the steepness of the line.
SLOPE = RISE / RUN
RISE is the vertical change & RUN is the horizontal change.
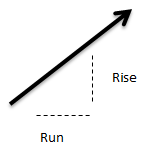
To fund the SLOPE, we take the “change in rise over a change in run”.
Examples of SLOPE:
Example 1: Look at the below graph.
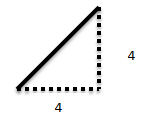
Slope of the line = 4/4 = 1
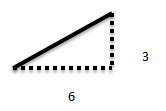
Example 2: Look at the below graph.
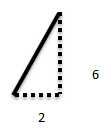
Slope of the line = 6/2 = 3
Example 3: Look at the below graph.
Slope of the line = 3/6 = 0.5
Example 4: Look at the below graph.
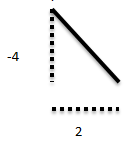
Slope of the line = -4/2 = -2
SLOPE Formula in Excel:
Below is the SLOPE Formula in Excel :
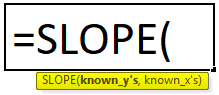
SLOPE Formula includes two arguments:
- Known_y’s: This is a range of cells of numeric dependent values.
- Known_x’s: This is a range of cells of independent numeric values.
The length of the Known_y’s should be the same as that of the Known_x’s, but the variance should not be zero.
How to Use the SLOPE Function in Excel?
SLOPE Function in Excel is very simple and easy to use. Let us now see how to use this SLOPE Function in Excel with the help of some examples.
Example #1
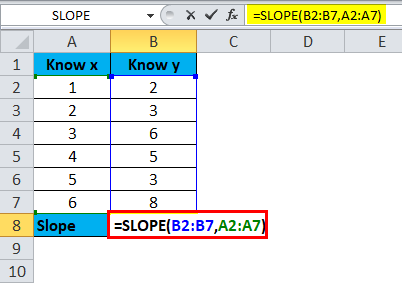
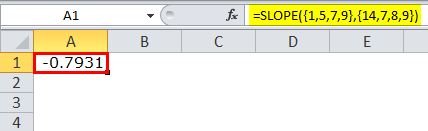
In this example, I have two sets of values (Known_y’s and Known_x’s). Calculate the slope of these two ranges using the SLOPE function in Excel.
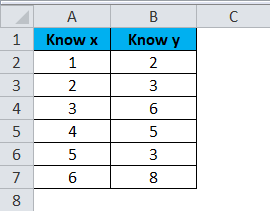
Apply the SLOPE Function to get the slope value of the line.
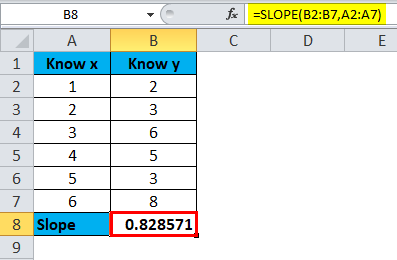
So the result will be :
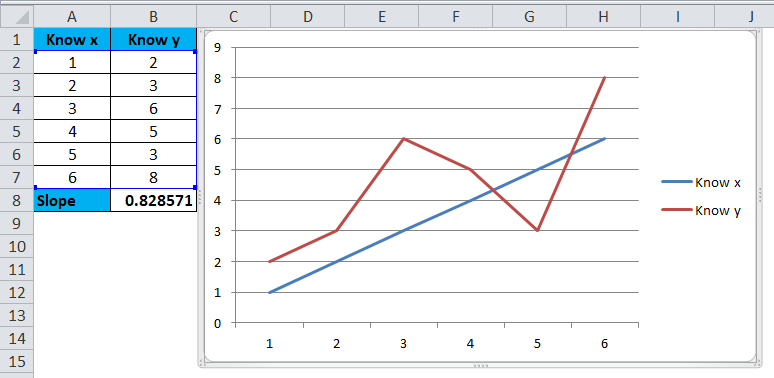
Insert graph for it.
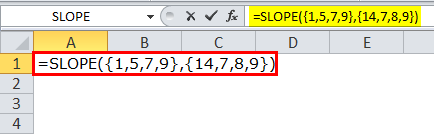
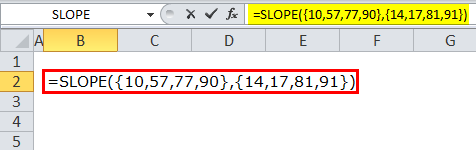
Example 2: We can directly enter the values into the formula itself but with curly brackets. Below images are examples of it.
Picture 1
So the result will be :
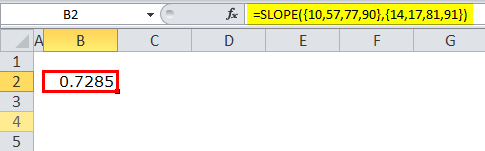
Picture 2
So the result will be :
SLOPE as VBA Function
Below is the code for running macro for SLOPE Function :
Sub SLOPE_Example()
Step 1: Declare variables
Dim Known_X As Range
Dim Known_Y As Range
Step 2: Set the object variables
Set Known_X = Range(“A2:A7”)
Set Known_Y = Range(“B2:B7”)
Step 3: Show the result in Message Box
MsgBox Application.WorksheetFunction.Slope (Known_Y, Known_X)
End Sub
Things to Remember
- Both the parameters should be of the same length. For example, if Known_y’s range is A2: A10, then Known_x’s values should be in the same length range.
- Both arguments can accept only numerical values; if there are text or string values, then it excludes those values. The arguments can contain numbers or names that contain numbers.
- Both arguments should not be empty; if any one of the ranges is empty, then the result will be #DIV/0!
- A variance of the two arguments should not be zero. If the variance is zero, then we will get #DIV/0!
- Learn the basics of SLOPE to understand the working method of SLOPE in Excel.
This has been a guide to the SLOPE Function in Excel. Here we discuss the SLOPE Formula in Excel and how to use the SLOPE Function in Excel, along with practical examples and downloadable Excel templates. You can also go through our other suggested articles –
