Create a Spreadsheet in Excel (Table of Content)
- What is Spreadsheet in Excel?
- How to Open Excel on a Computer (Windows 8,10,11)?
- How to Create a Spreadsheet in Excel? (With Template)
- Example #1: How to Enter Data in a Worksheet
- Example #2: Personal Monthly Budget Spreadsheet
What is Spreadsheet in Excel?
A spreadsheet is a page that looks like a table with a collection of rows and columns. It is perfect for storing and managing personal or business data.
You can also perform calculations on the data using over 400 functions and features, such as pivot tables, graphs, charts, conditional formatting, etc.
A group of spreadsheets is called a workbook in Excel. It means that one workbook can have many worksheets, where each worksheet has access to all the Excel features. You can use spreadsheets on Office 365, which is an online program, or on MS Office, a program you install on your computer.
How to Open Excel on a Computer (Windows 8,10,11)?
- Click on the “Search Box” at the bottom-left end of the Window’s desktop screen.
- Type “Excel”.
- Click on the Excel Icon, as seen in the screenshot below.
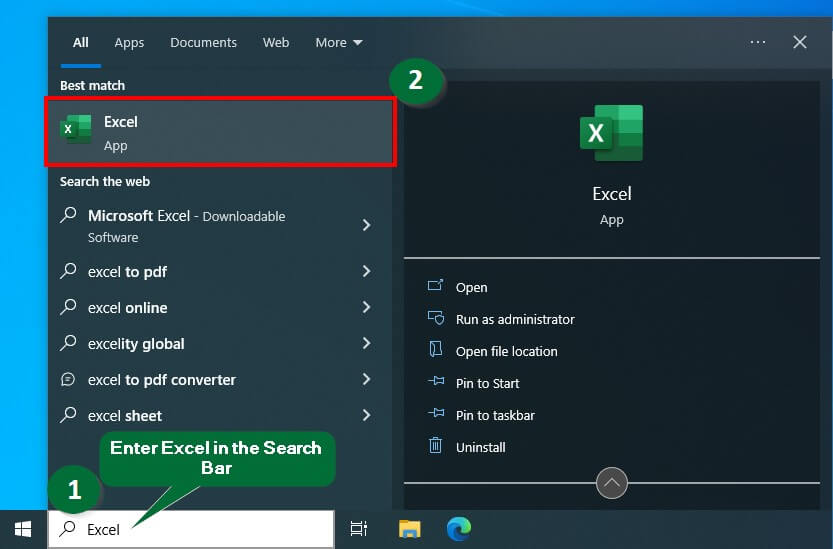
Microsoft Excel application will launch.
How to Create Spreadsheet in Excel?
You can use the step below to learn how to make a spreadsheet in excel.
Step 1: Open MS Excel.
Step 2: Go to Menu and select New >> Click on the Blank workbook to create a simple worksheet.
OR – Press Ctrl + N: To create a new spreadsheet.
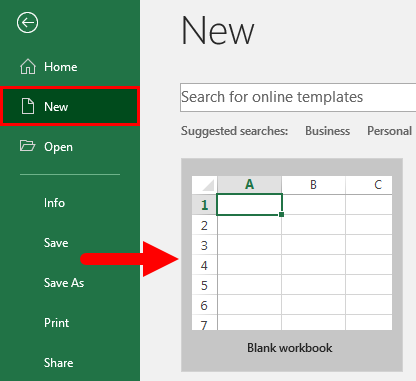
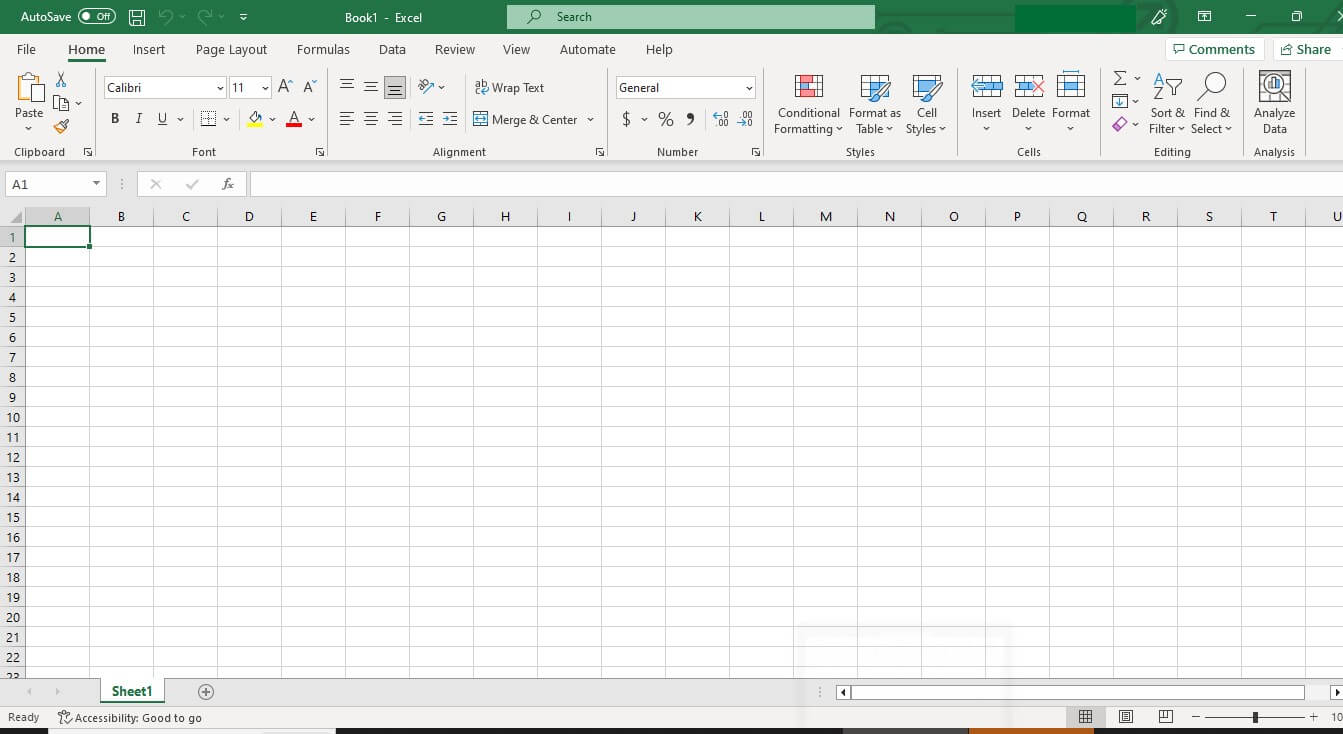
Step 3: By default, Sheet 1 will be created as a worksheet in the spreadsheet. The spreadsheet’s name will be Book 1 if you open it for the first time.
Example #1: How to Enter Data in a Worksheet
In this example, you will learn to enter data in a worksheet and calculate the total marks of students.
Let’s see how we can do this by opening a new spreadsheet.
Step 1: Click on the “File” tab.
Step 2: Select “New” and click “Blank workbook”, as shown below.
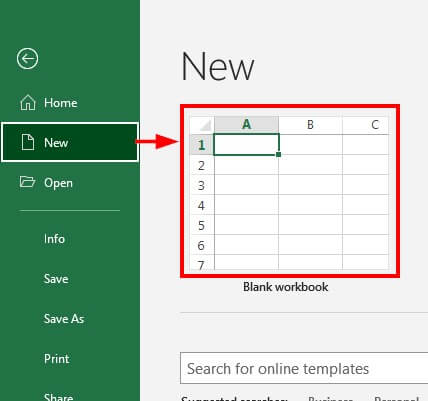
A new workbook is created, and “Sheet1” is open, as shown below.
Now, let’s enter data in the worksheet.
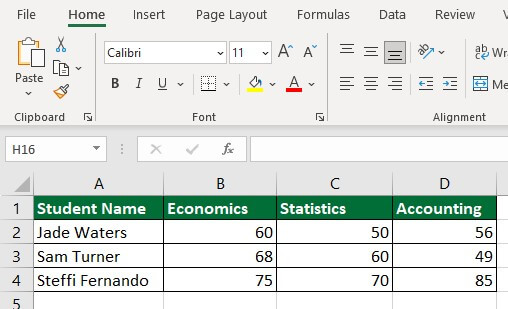
Step 3: Select any cell and start typing. Here, we have selected “Cell A1” and will add headings for our table.
Step 4: Enter “Student Name” as shown below.
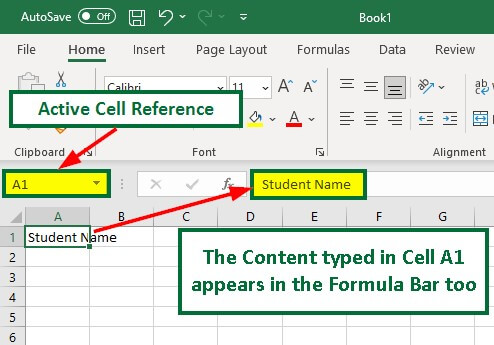
As you can see, the word “Student Name” didn’t fit properly in the cell.
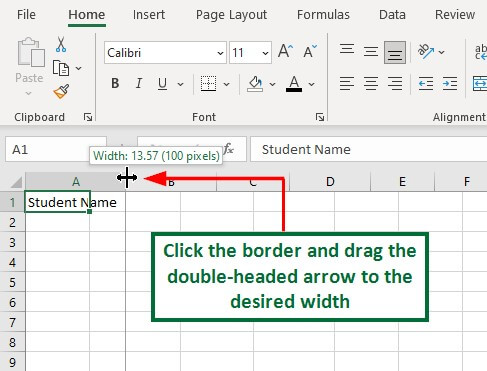
Step 5: To fit it, select the border between column A and column B. A double-headed arrow will appear. Move this arrow to the desired width, as shown below.
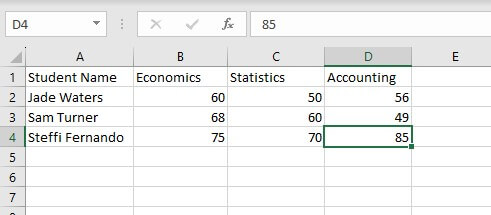
Step 6: Enter all data, as shown in the below image.
Let’s add a border to the table.
Step 7: Select the whole data and go to the “Home” tab and click on “Borders” under the “Font” group, as shown below.
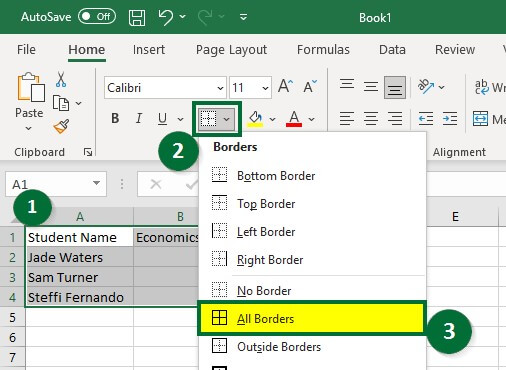
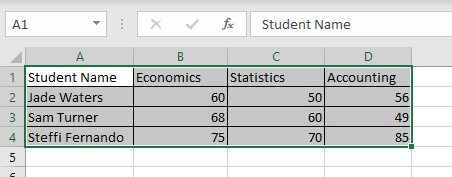
The border is applied to each selected cell.
Let’s learn how to format cells in an Excel spreadsheet.
Step 8: Select the heading and click on “Bold”; select the desired color from “Fill Color,” and “Font Color” under the “Font” group of the “Home” tab. See the below image.
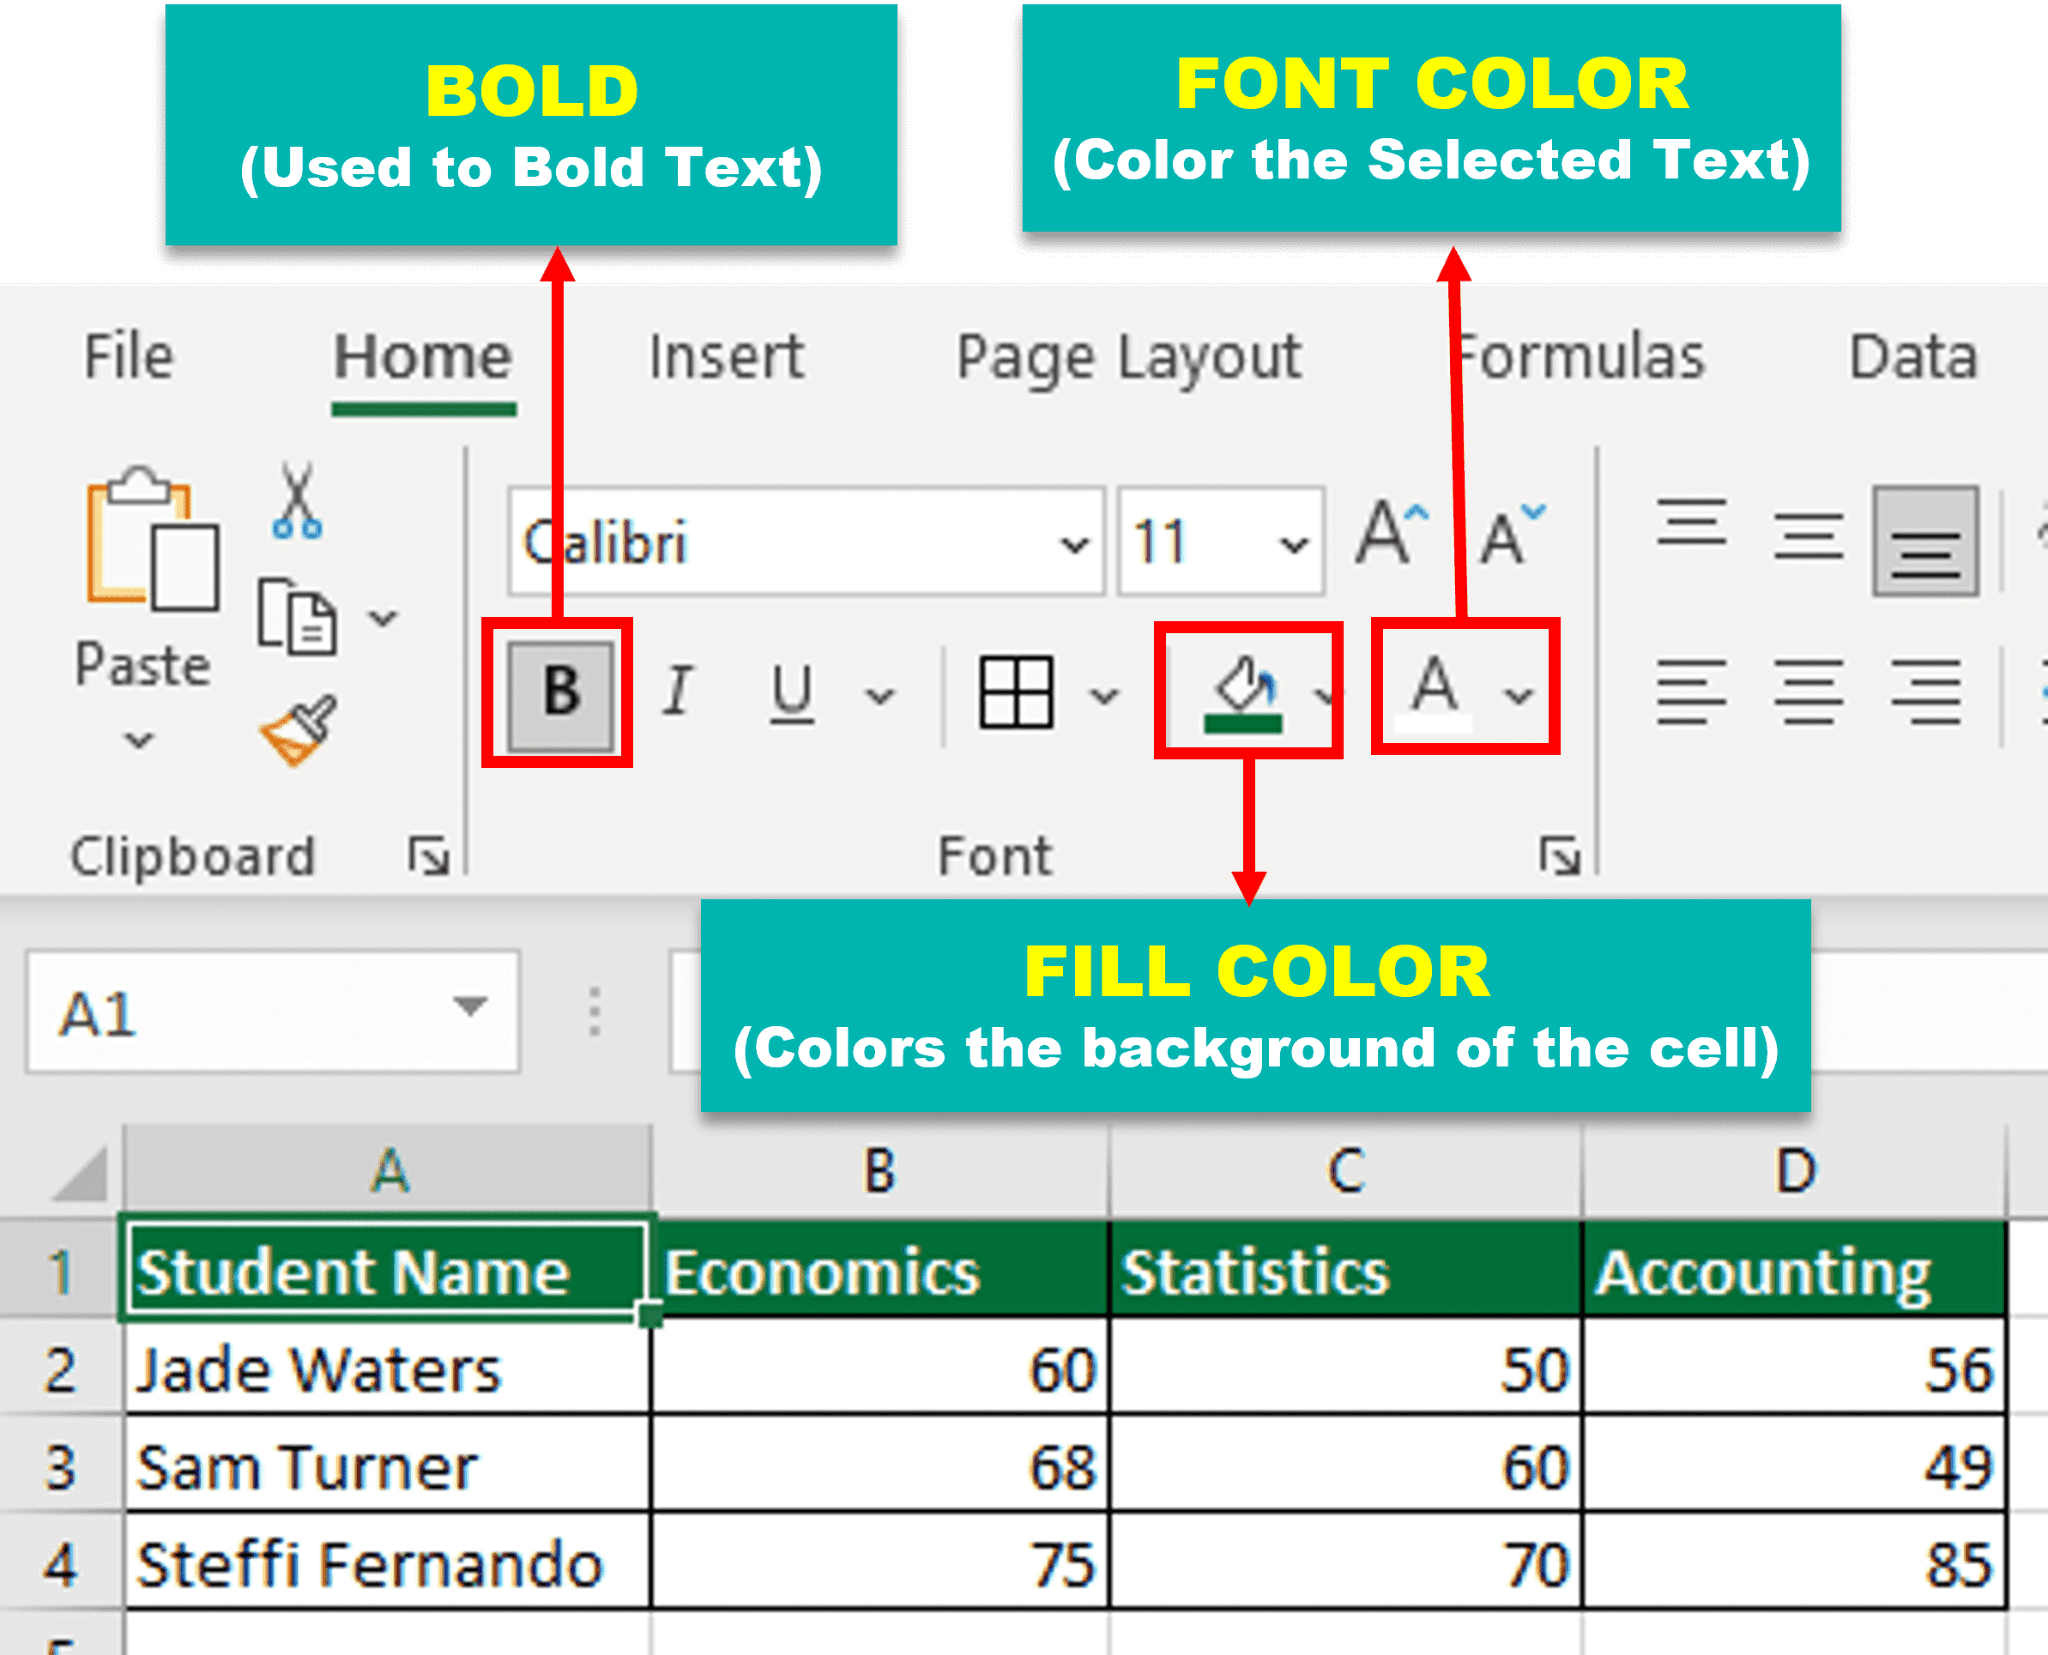
We have selected dark green from the “Fill Color” and White from the “Font Color” options.
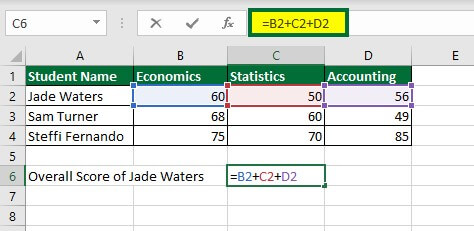
Let’s now calculate the total marks of students.
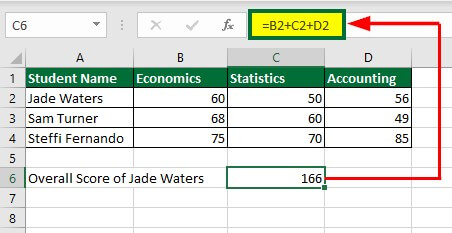
Step 9: Select “Cell C6” and enter the formula: =B2+C2+D2
Or, else, you can enter “=” and select “Cell B2”, then “+” sign, select “Cell C2”, +, and so on. Automatically the selected cell will appear on “Cell C6”.
Step 10: Press “Enter” from Keyboard.
Now, we will save this workbook.
Step 11: Select “File” from the Ribbon.
Step 12: Click on “Save As”, as shown below.
Step 13: Enter the file name and click save, as shown below.
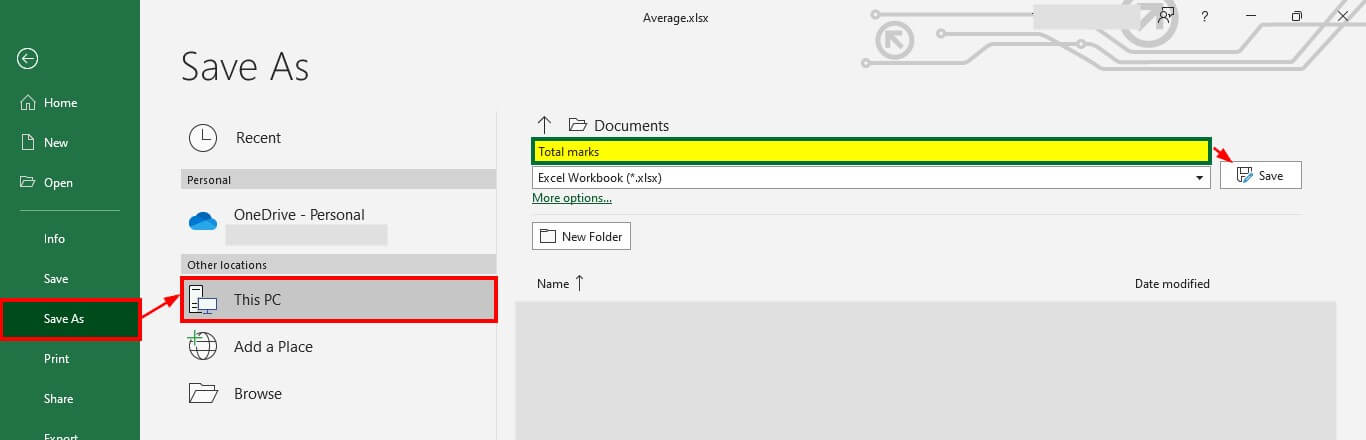
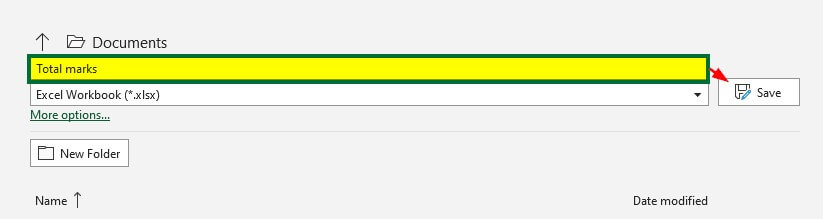
This “Total marks” Excel workbook file is saved under the “Documents” folder.
You can choose your desired location and give any name to the file.
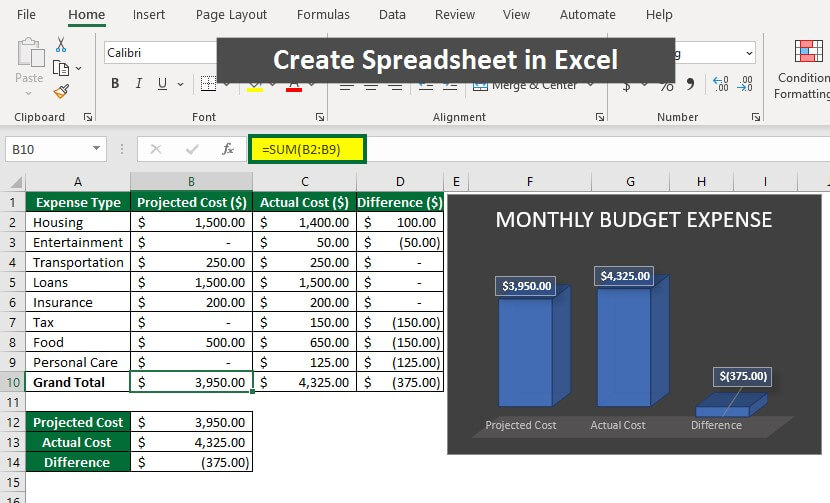
Example #2: How to Create a Personal Monthly Budget Spreadsheet in Excel?
In this example, you will learn how to make an excel spreadsheet for a personal monthly budget.
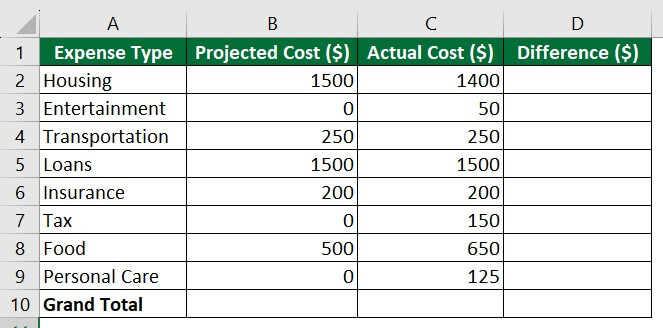
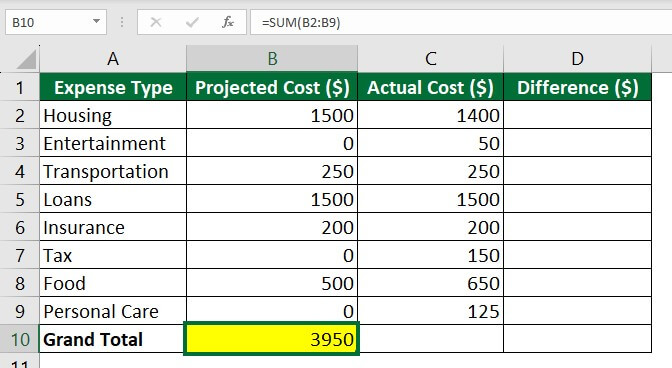
Step 1: Enter the data in a new spreadsheet.
Step 2: Select “Cell B10” and enter the formula: =SUM(B2:B9)
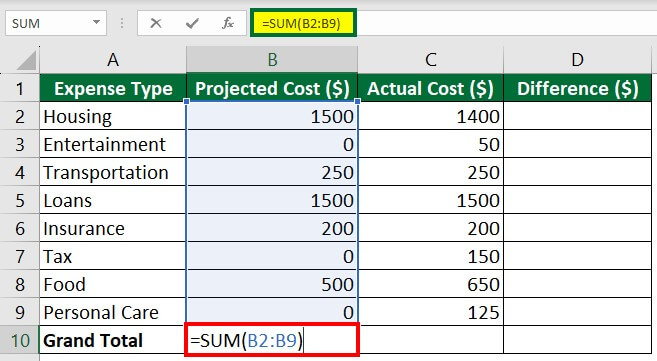
Step 3: Press “Enter”. The formula will display the total projected cost in Cell B10.
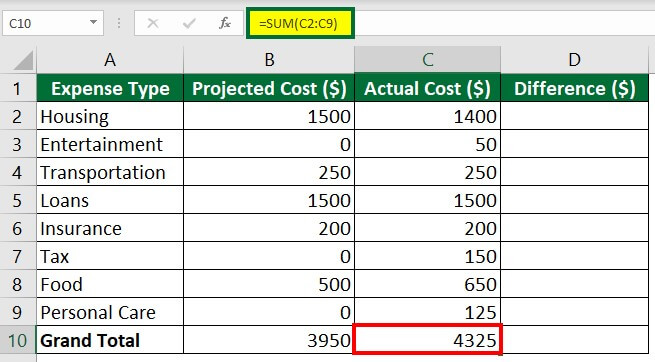
Step 4: Select “Cell C10” and enter the formula: =SUM(C2:C9)
Step 5: Press “Enter”. The formula will display the total actual cost.
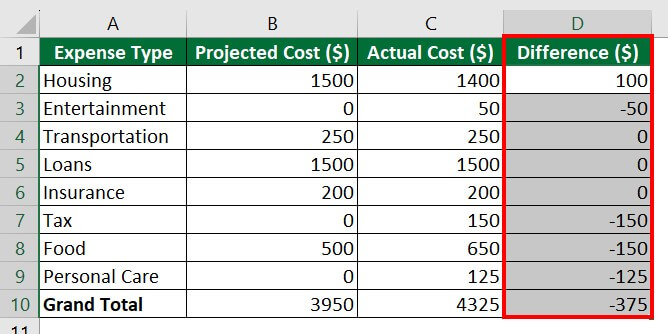
Step 6: Enter the below formula in “Cell D2” to calculate the difference.
=B2-C2
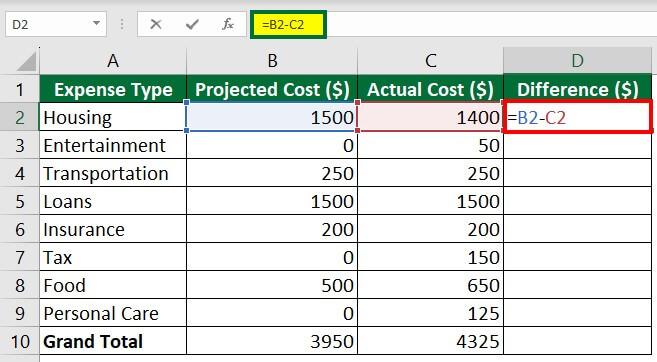
Step 7: Press “Enter”. The formula will display the difference between projected and actual costs.
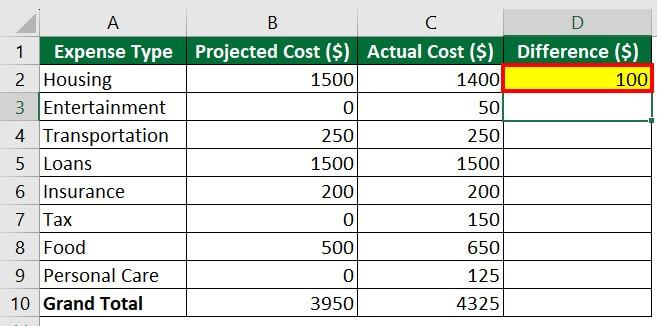
Step 8: Drag Cell D2 downwards.
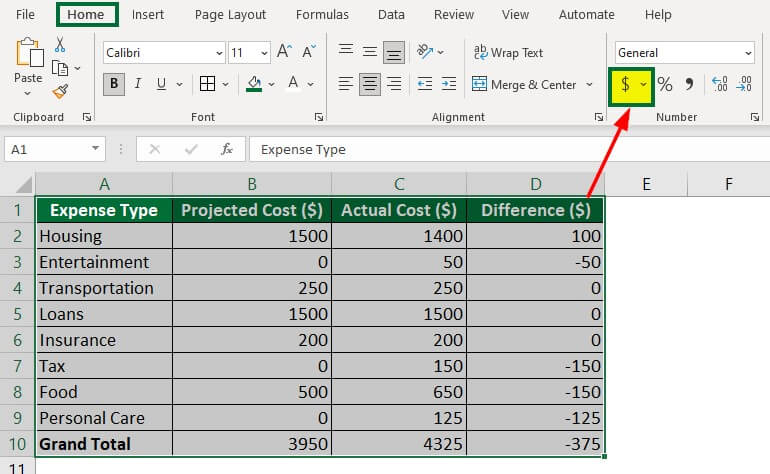
We will add a dollar sign to all cells of the data.
Step 9: Select the whole data, go to the “Home” tab, and select the dollar sign under the “Number” group. See the below image.
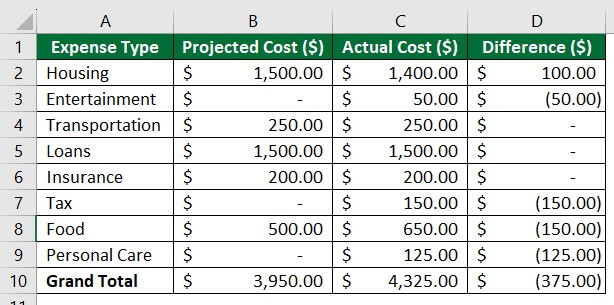
The image below shows that the dollar symbol is assigned to every data cell.
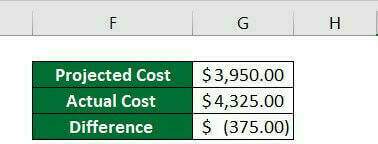
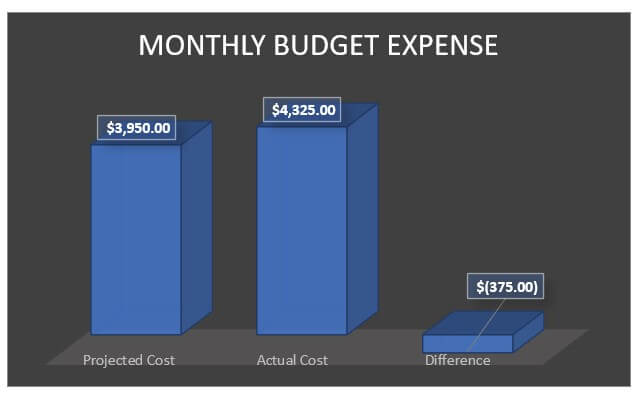
Step 10: You can also create a result table to display only the total projected cost, total actual cost, and the difference between them. See the below image.
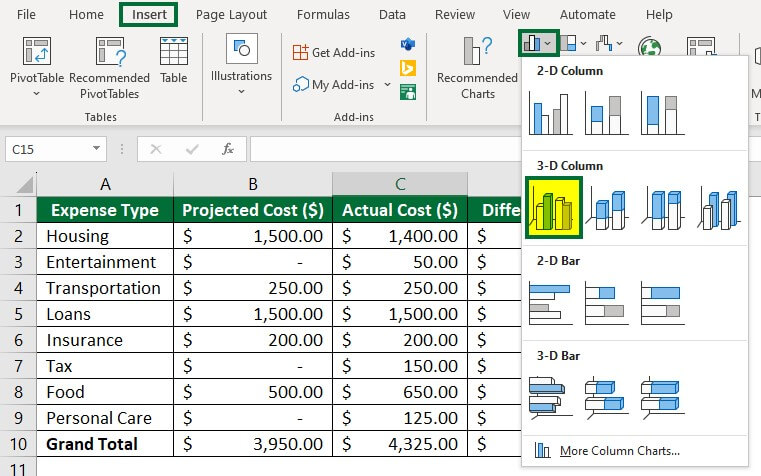
Let’s make a pie chart to make this result table more attractive.
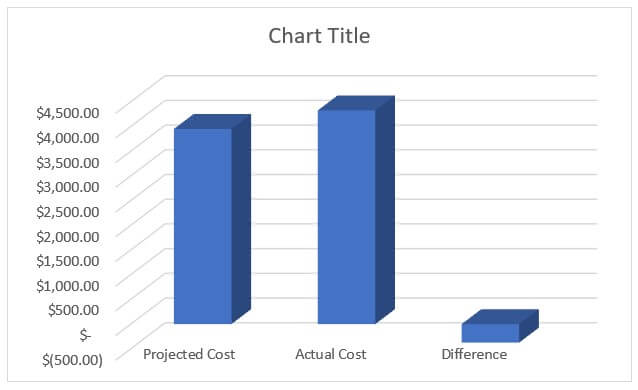
Step 11: Select the result table, go to the “Insert” tab, and select the desired option of the bar chart under the “Charts” group. See the below image.
The below bar chart will appear.
Step 12: Select the desired design format under the “Chart Styles” group of the “Chart Design” tab.
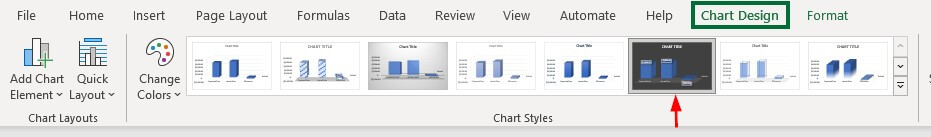
The bar chart has been changed to the new style format.
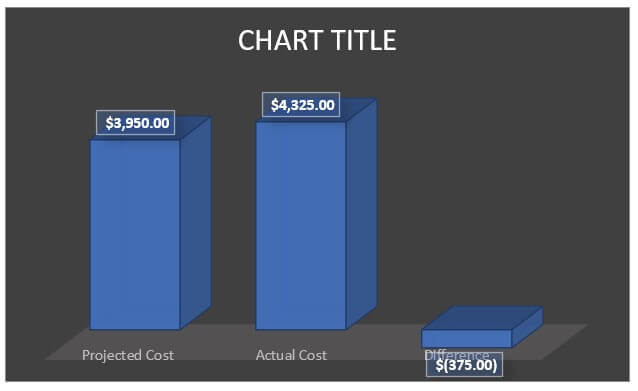
Step 13: Double-click on the chart title and change the name of the bar chart.
The bar chart is ready.
Once you create an Excel Spreadsheet, you can convert it to a universally accepted format like PDF. For convenience, some useful Excel to PDF converters convert Excel to PDF files for free while maintaining the original formatting.
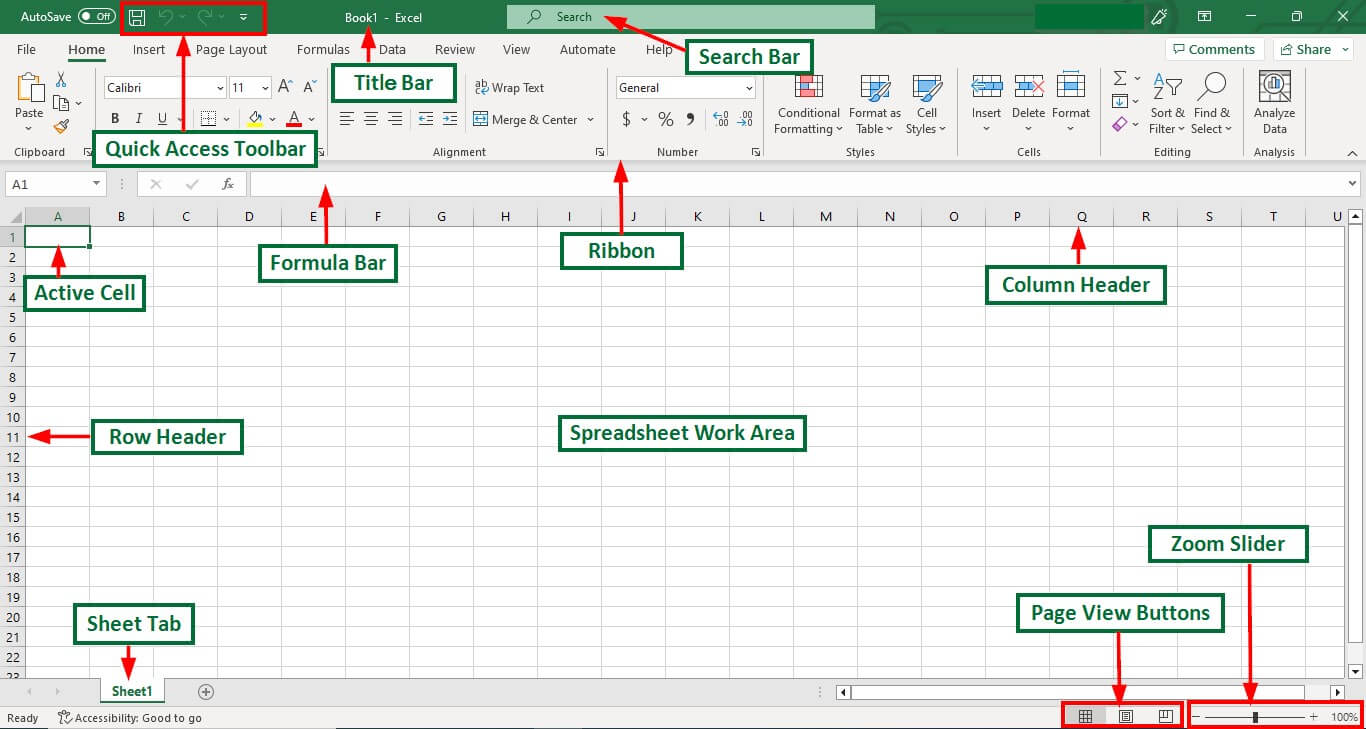
Key Features of Excel Worksheet
| What does it mean? | Purpose | How to use it? | |
| Spreadsheet Work Area | The main center area consists of columns and rows in the form of a grid. | Enter and manipulate data. | For instance, if you create a travel plan worksheet, you can enter details like Flight Details, Cities, and Hotels in the spreadsheet work area. |
| Active Cell | The active cell, also called cell address, is the currently selected cell in a spreadsheet. | It specifies the location of the cell. | If you enter “Flight Details” in Cell C1, then Cell C1 becomes the active cell. |
| Column Header | Columns are designated using the letters A to Z. After Z, the column is referred to as AA, AB, AC, and so on. 16,384 is the maximum number of columns in the newer version of Microsoft Excel. | It helps to identify the column location of the selected cell. | You can label Column A as Cities and Column B as Hotels in the worksheet. |
| Row Header | It is located on the extreme left side of the spreadsheet. Rows are labeled with numbers like 1, 2, 3, etc. There are 1,048,576 rows in the newer version of Microsoft Excel. | It helps to identify the row location of the selected cell. | For instance, Row 1 can represent “Switzerland,” and Row 2 can represent “Paris“. |
| Formula Bar | It displays the content of the selected cell. | You can enter and edit text, functions, and formulas in the formula bar. | If you enter the formula =SUM(D1:D5) in Cell D6, this same formula will also be visible in the Formula Bar. |
| Sheet Tab | It is located at the bottom left of the spreadsheet program window. | You can navigate between worksheets by clicking on the sheet tab. You can also add, delete, hide, and rename worksheets. | You can switch between the “Itinerary” and the “Budget” sheets by clicking on the desired sheet tab. |
| Ribbon | It is the grey area below the Title Bar. | It helps to access various tabs such as Home, Insert, Formulas, Data, Page Layout, View, Review, etc. | For instance, in the “Home” tab of Excel, you can format cells, change alignments, and many more. |
| Title Bar | It is the green part at the top of the Excel sheet. | Displays the name of the current spreadsheet/ workbook and its extension. It also contains Quick Access Toolbar, Search Bar, and Minimum, Maximum, and Close options. | For instance, the Title Bar will show the name as, Travel Expenses Tracker.xlsx. |
| Quick Access Toolbar | It is located in the top-left end of the Title Bar in the Excel spreadsheet. | Quick access to commonly used functions and tools | It includes Save, Undo, Redo, and Print. |
| Search Bar | It is located at the center of the Title Bar. | Allows searching and finding specific text, functions, or commands within the active spreadsheet. | You can search for a city name or hotel within the spreadsheet. |
| Zoom Slider | It is located at the bottom right of the spreadsheet program window. | It allows you to increase (zoom in) and decrease (zoom out) the cell’s contents. | You can zoom out to view the content of cells. |
| Page View Buttons | It is located at the bottom of the program window, right to the Zoom Slider. | It consists of three modes to view spreadsheets like Normal View, Page Layout View, and Page Break View. | You can use the normal view for editing and the page layout view for printing. |
How to Insert a New Spreadsheet?
The simplest way to add a new worksheet in Excel is to click on the + sign next to the currently opened sheet. See the below image.
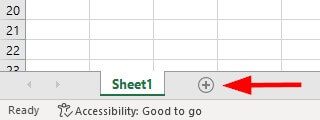
A new sheet is created with the “Sheet2” name.
Or else,
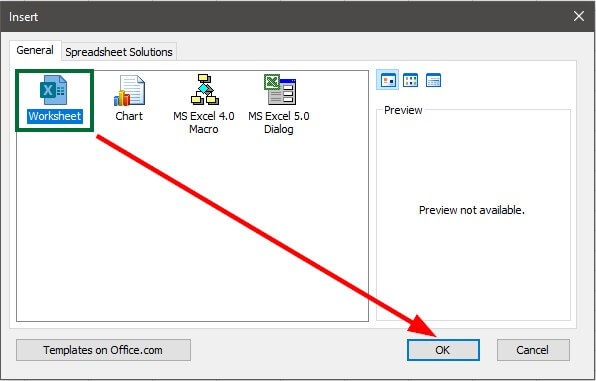
You can right-click “Sheet1” and select “Insert”.
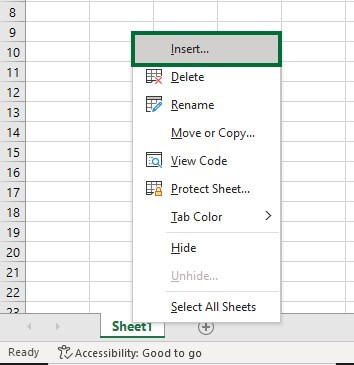
An “Insert” window will open.
Select “Worksheet” and click “OK”, as shown below.
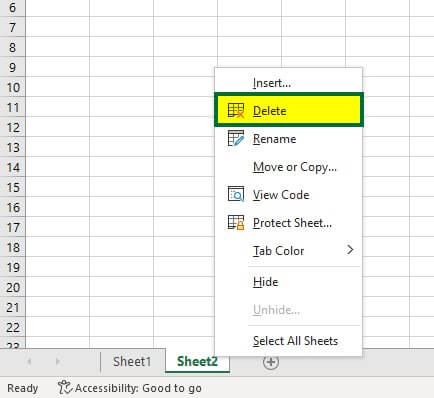
How to Delete Worksheet in Excel?
Right-click on the worksheet you want to remove and select “Delete”, as shown below. Excel will delete the worksheet.
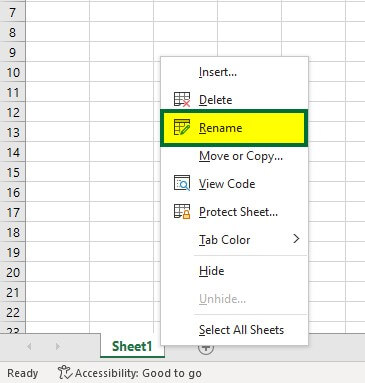
How to Rename a Worksheet in Excel?
Right-click on the worksheet you want to rename and select “Rename” from the dialog box, as shown below.
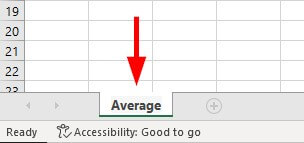
We have renamed Sheet 1 to Average.
Frequently Asked Questions (FAQs)
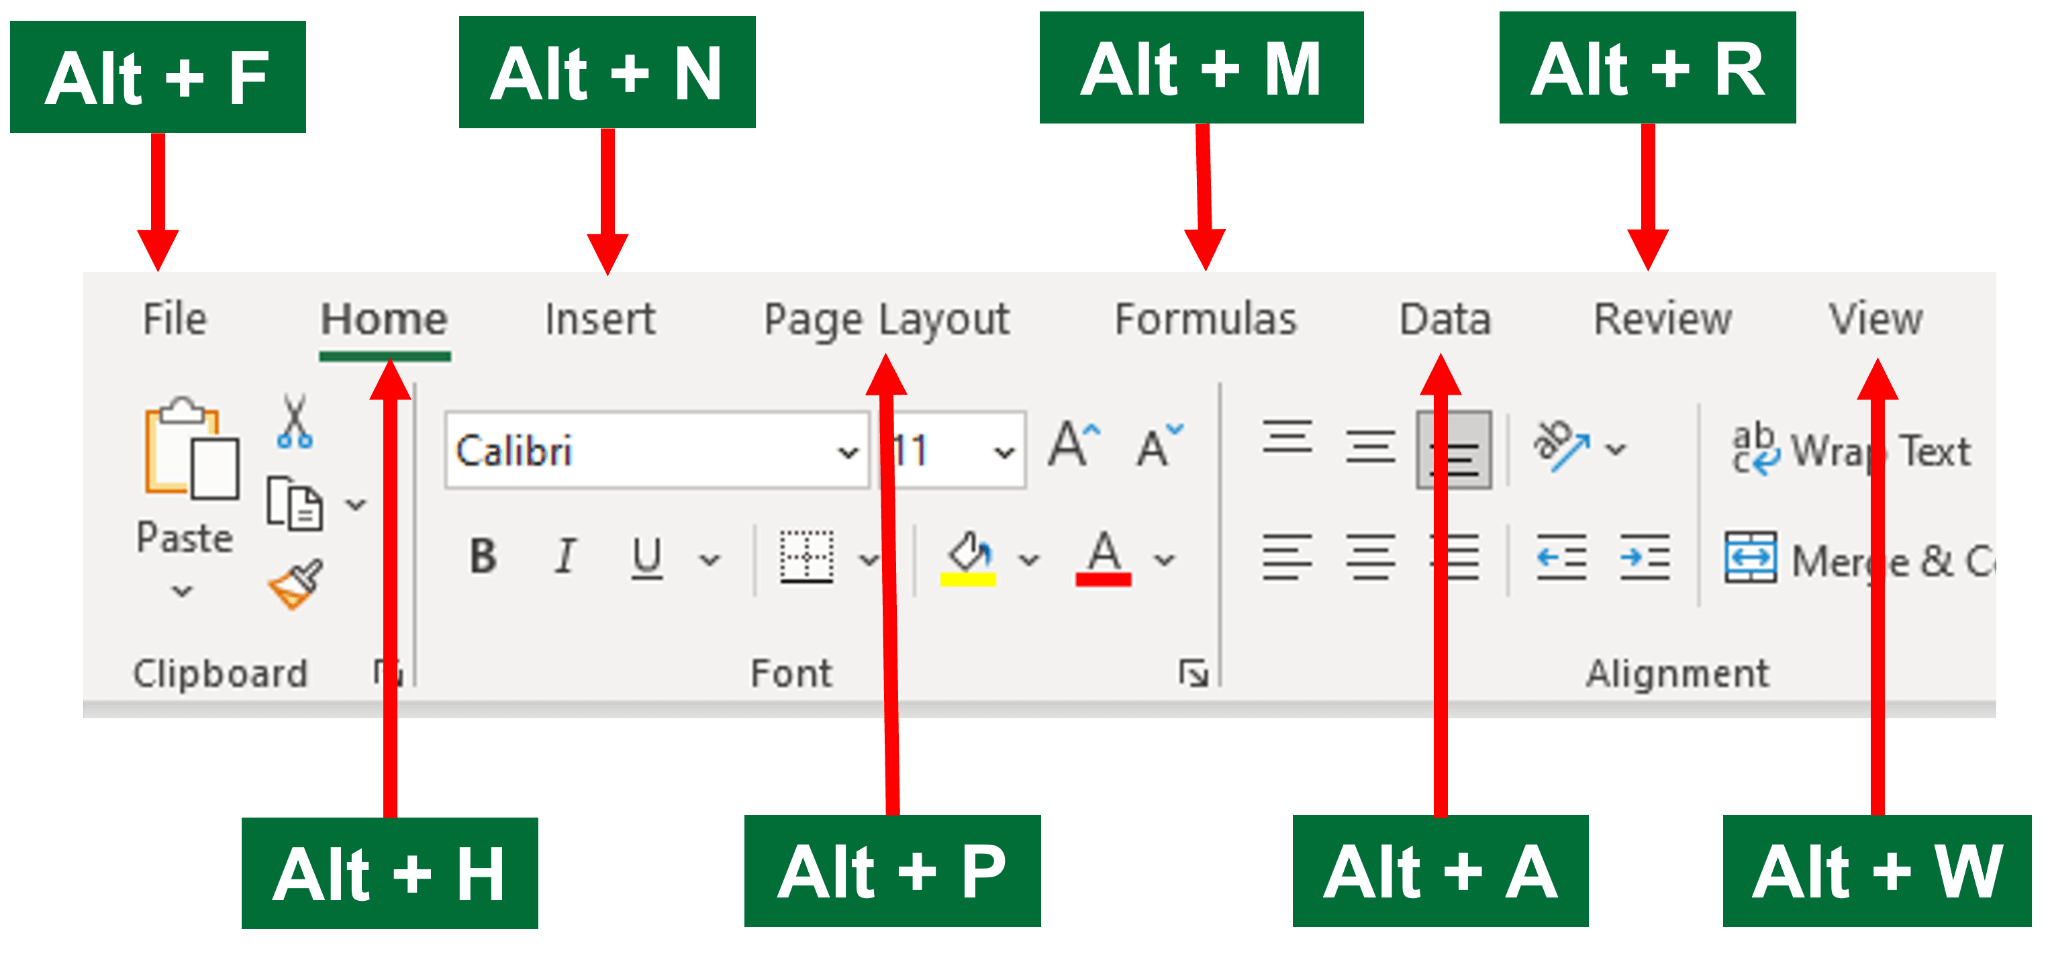
Q1. What are the shortcut keys for ribbon for Excel?
Answer:
Q2. Why create a spreadsheet?
Answer: Any beginner can use a spreadsheet to store and organize data for calculation and analysis. Spreadsheets also serve as a digital record-keeping system for generating reports, tracking expenses, inventory management, project planning, budgeting, and accounting.
Q3. How many worksheets are there in Excel?
Answer: There is a maximum of 255 separate sheets in one workbook.
Q4. What is spreadsheet format?
Answer: The format to save a spreadsheet file in Excel is .xls, .xlsx, and .xlsm.
Video Tutorial: How to add data to a spreadsheet?
Recommended Articles
This article is a comprehensive guide to Create Spreadsheet in Excel. Here we have discussed how to create a Spreadsheet in Excel, examples, and a downloadable Excel template. You may also look at the following articles to learn more –
