Updated November 22, 2023
Roadmap Template in Excel (Table of Contents)
Explanation of Roadmap Template in Excel
Roadmap Template in Excel is a tool used to measure, trace and forecast the performance of any product. It consists of all types of information required for any product. Every product must have stages from Completed, Current, Near Term, and Future, and each stage must have the activities involved. To create a Roadmap template in Excel, give a heading to the template, then list all the stages and activities under them in a different column and prioritize Low-Medium-High with a separate column for Results. To access and apply any roadmap template, we can get that from the MS Office website.
The project roadmap should contain the following:
- Important milestones
- Key events, timeline
- Duration of each event & deliverables
How to Create a Roadmap Template in Excel?
The roadmap Template in Excel is very simple and easy. Let’s understand how to create a Roadmap Template in Excel with some examples.
Example #1
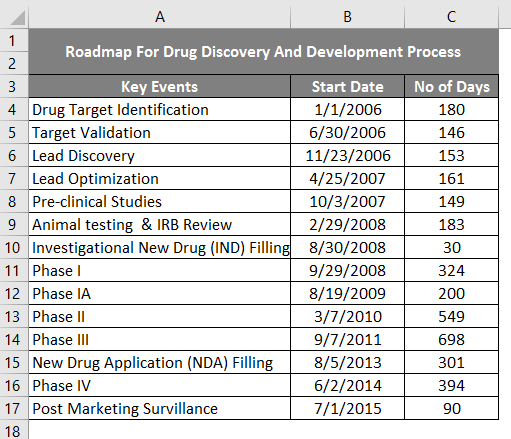
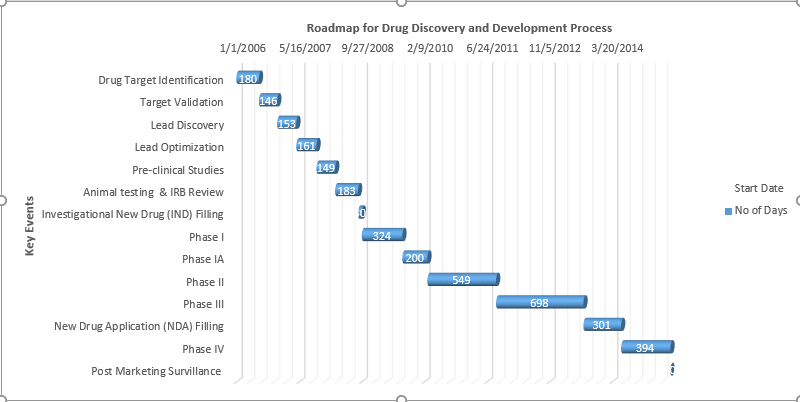
Initially, we need to enter the data table consisting of three columns, i.e., Key event or milestone, start date & time taken, or task duration (No of days).
The table contains a list of each task or milestone of the project from beginning to end, with a time frame for each event. Including Key Events & Decisions, the Start Date of that event & the No of days to complete it, or the duration for each event.
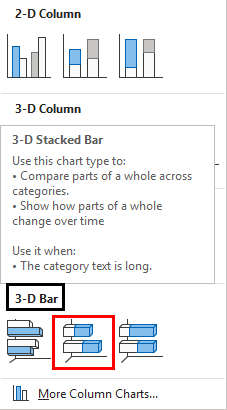
Go to the Insert tab and select 3-D Stacked Bar Chart.
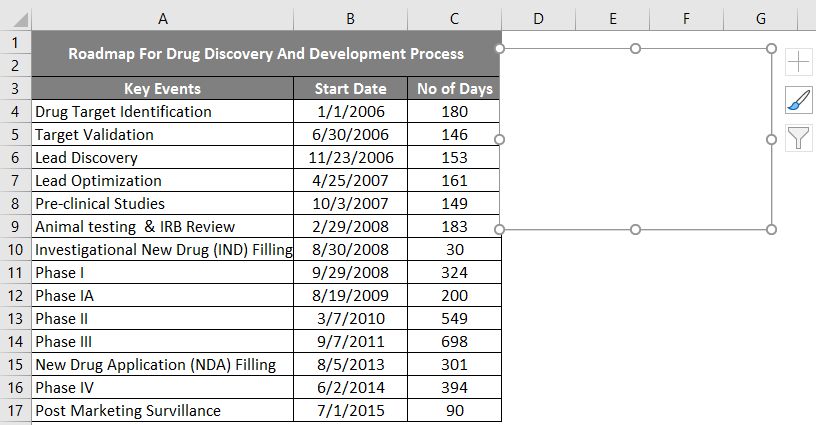
Now, a blank chart area appears next to the table range.
On the chart area, right-click, under that, select the option of “select data”, and select the data source dialog box window.
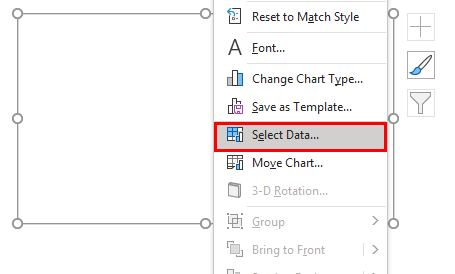
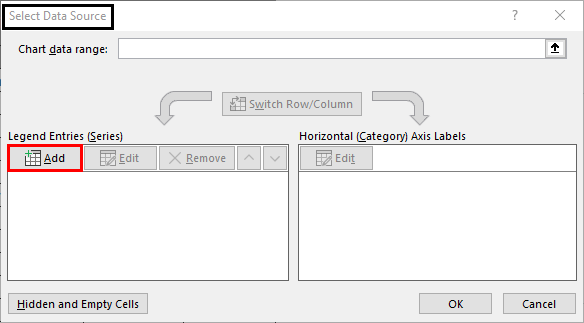
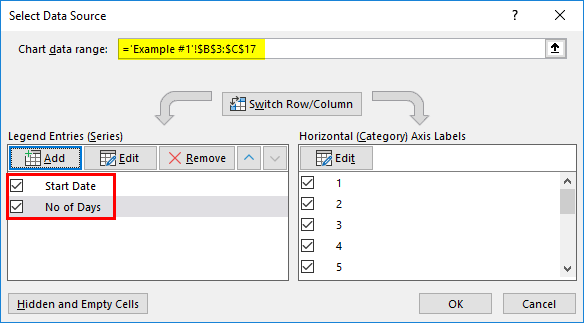
Select the Add option in the legend entries in the Select Data Source dialog box (Series).
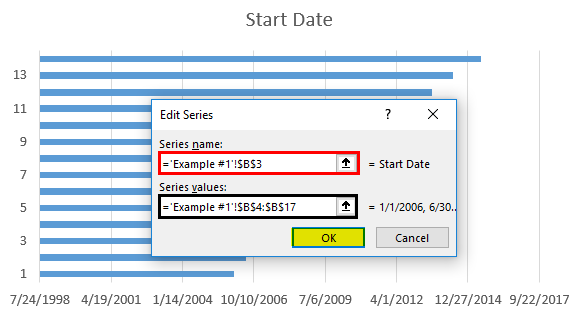
Now, we need to enter each column data set of table range, edit series window dialog box appears, in that, initially select the start date column range, i.e., in that series name to enter start date column title name cell, i.e., “B3”, Later in the series values, enter the start date range, i.e., by selecting from cells “B4” to “B17” and click on OK, now start date with data bars appear in the chart area (Blue Color).
Click on OK, and again the Select Data Source window appears, in which you can observe Date Series added.
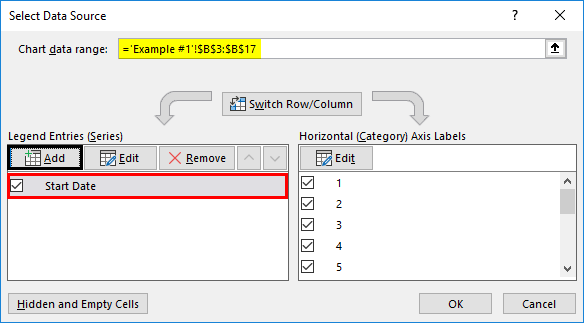
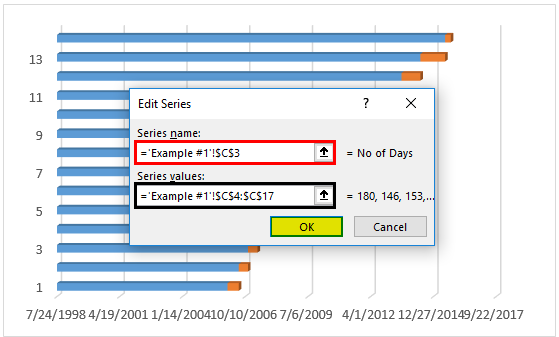
In the select data source dialog box window, select add option in the legend entries (Series); again, you need to select the “No of days” column range, i.e., in that series name, enter the “No of days” column title name cell, i.e., “C3”, Later in the series values, enter the “No of days” range, i.e., by selecting from cells “C4” to “C17” and click on ok, Now “No of days” with data bars appear in chart area (Orange color).
Once you click ok again, the Select Data Source window appears.
Now the Axis label range needs to be added, and the Axis label popup appears.
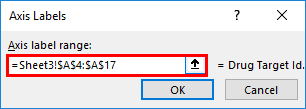
To enter data in the axis label range text box, select a key events range, i.e., from cells “A4” to “A17”, and once you click OK, the chart will be shown below.
All the tabular data is now represented on the chart; you can resize the chart area based on your preference by dragging towards the right & left. Currently, some issues in the chart, i.e., Key events are in reverse order: It can be rectified by right click on key events and Select Format Axis.
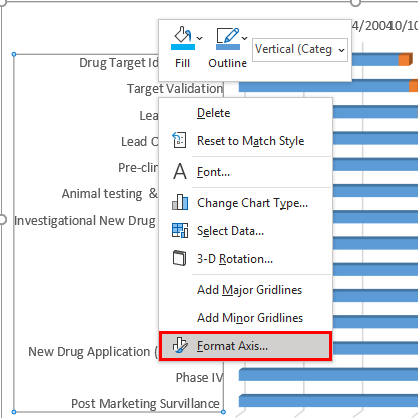
Format axis window appears. In that checkmark, the Categories are in reverse order.
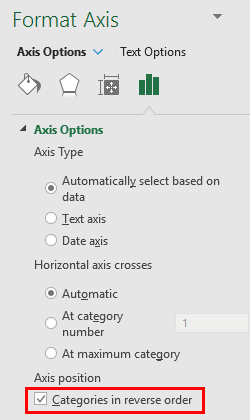
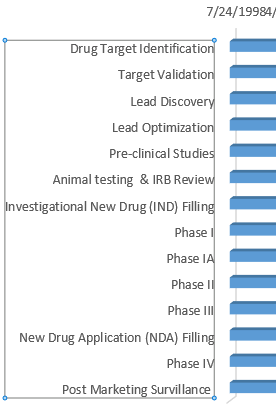
Once the categories in reverse order are selected, key events appear in the correct order based on the start date.
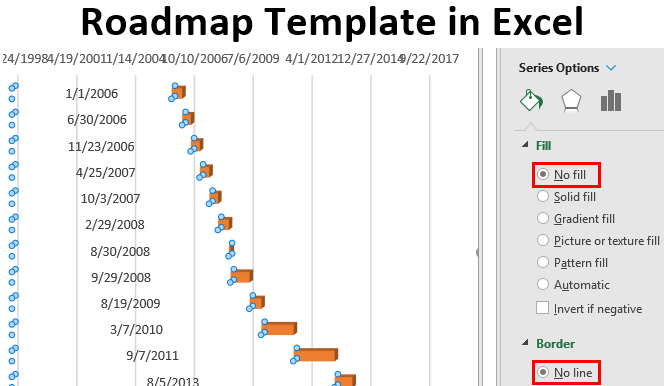
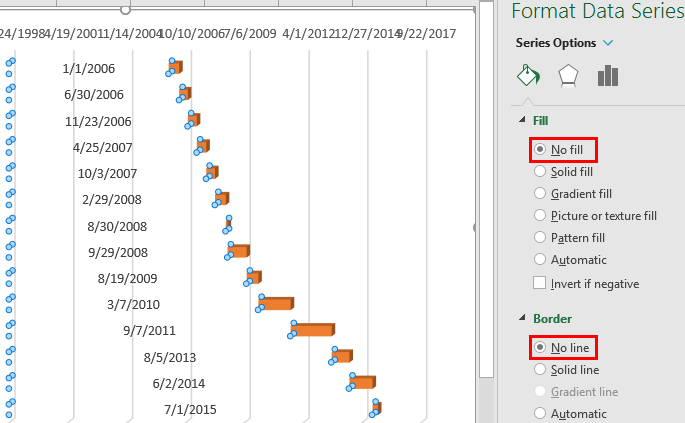
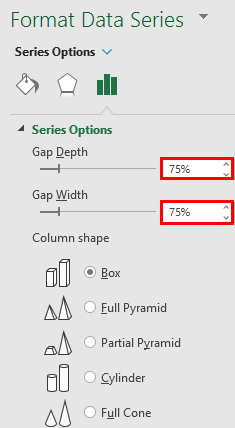
Now, we need to remove the blue data bars representing Start Date by clicking on it & Select Format Data Series.
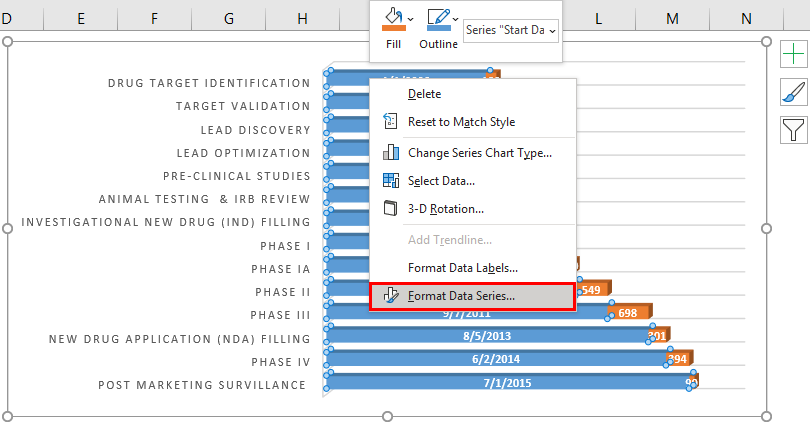
Format data series window appears; in that, select the option of no fill & no line so that the Blue data bars disappear & you select those date range in the blue data bars & delete it.
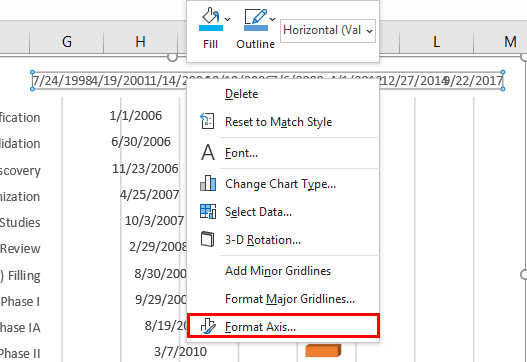
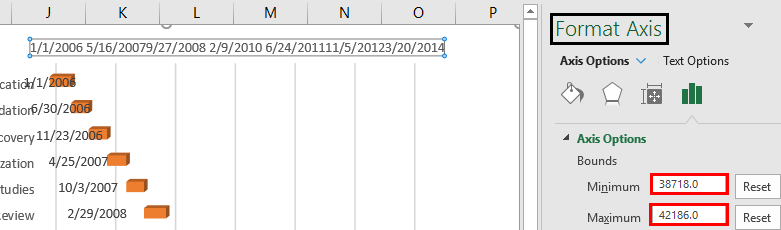
Now, we need to set a date range to eliminate the huge gap in the date range; it can be rectified by selecting the date series by clicking on Format Axis.
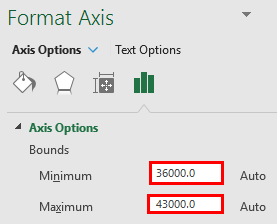
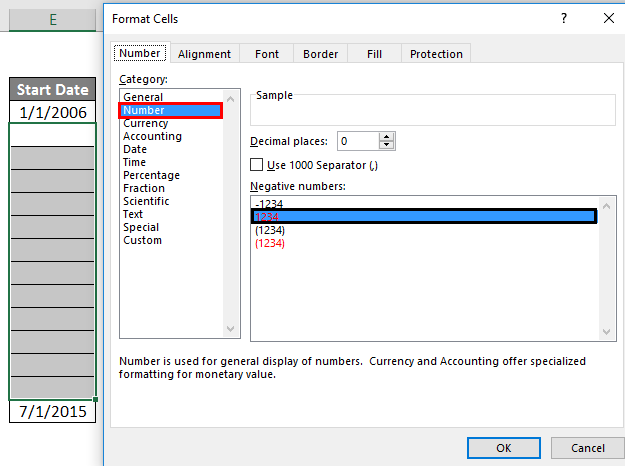
Now, we need to set the minimum & maximum bounds range; the minimum range is set by selecting the first event date and, converting the start date format to number format, and check out for the number & copy-paste it to the minimum text box.
Convert the Date into a Number Format.
Copy the start date number format of the first event & last event and paste it into minimum & maximum under axis options in the bonds section; once you update the date in the minimum text box, you can see the change in the date series range, i.e., from 1/1/2006 instead of 7/24/1998
Note: Maximum bond, you can set as 42300 for better appearance.
The orange date bars & values in it can be formatted as per your choice; here, I changed the data bar color from orange to blue color & converted it from box bar to cylinder bar, and the font format of the numeric value in it from black to white color for a better appearance.
Go to the Design Tab. Click on Quick Layout.
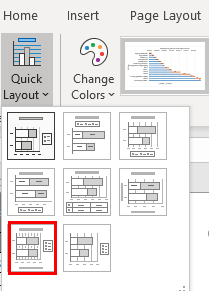
Now, click on the Quick Layout tab and select the chart as shown below.
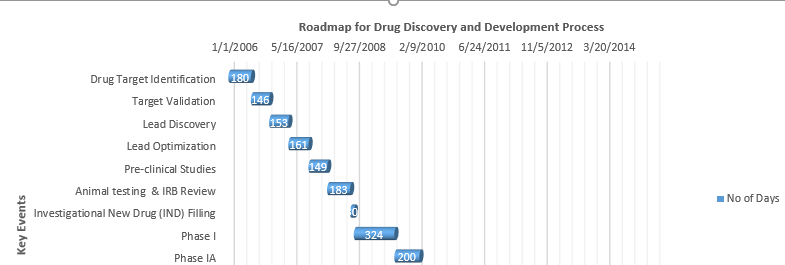
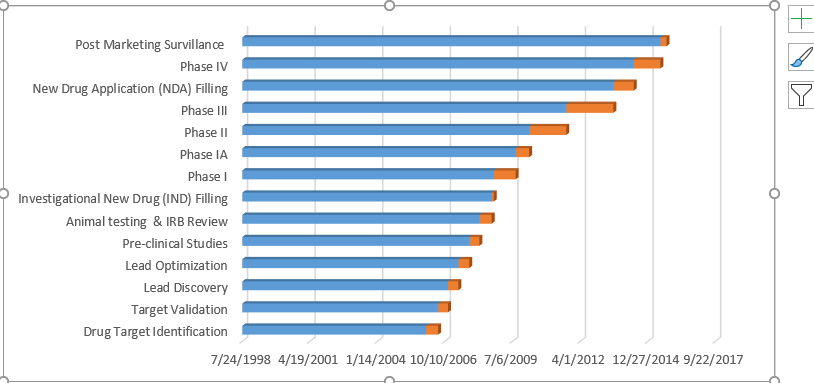
In the layout 7 design, we can add the Title at the top of a chart as “Roadmap for Drug Discovery and Development Process“, the vertical axis title as “Key Events“, and The days.
Add the start date data range before the chart’s Key Events to determine the start date of each event or milestone.
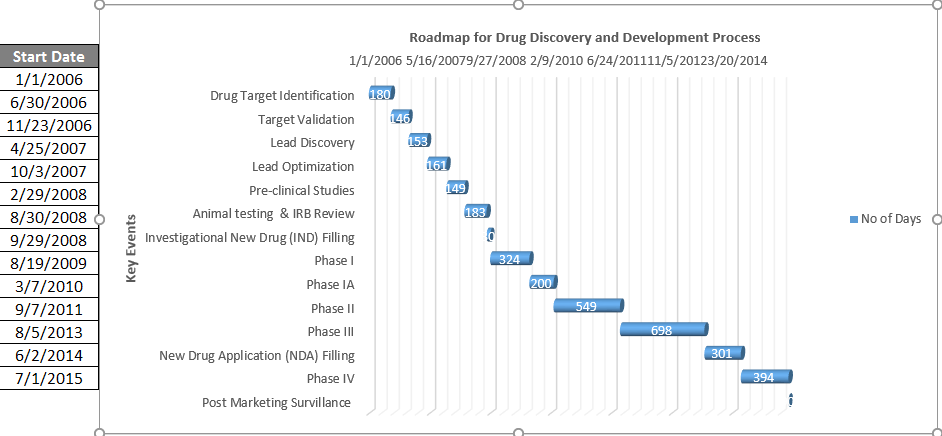
Here data series are linked to the chart; once you update the date or event, the chart automatically gets updated.
Things to Remember About Roadmap Template in Excel
- The roadmap template helps reduce the time spent in each phase of a project with updated planning & insights to projects.
- The roadmap template is most commonly used by product managers of pharma & IT companies.
Recommended Articles
This is a guide to the Roadmap Template in Excel. Here we discuss How to Create a Roadmap template in Excel, practical examples, and a downloadable Excel template. You can also go through our other suggested articles –
