Updated March 10, 2023
Introduction to R Tree Package
The R tree package is a package specifically designed to work with the decision trees. This package allows us to develop, modify, and process the classification as well as the regression trees in R programming, which will help us make the precise decisions related to the business problems.
This article will walk you through the tree package in R, how to install it, how it can be used to run the decision, classification, and regression trees with hands-on examples.
How to Install the tree package?
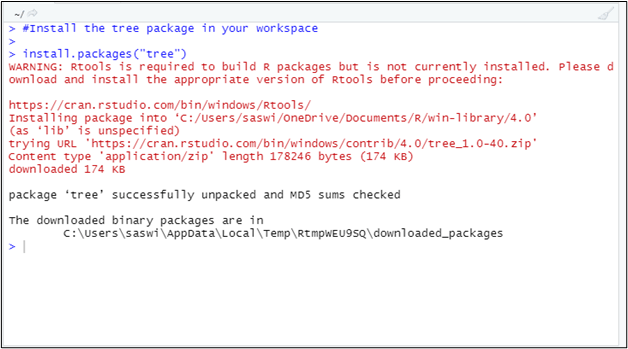
To install the package in the R workspace, follow the code below:
#Install the tree package in your workspace

install.packages("tree")
See the output for the installation as shown below:
How does the Tree Package work?
For this article, we are going to use carseats data. This is a built-in dataset that comes with the built-in packages in R. We will now read this data and try to store it as a copy under the new object.
#Reading the cars data and storing it as a new object in R

data <- Carseats

head(data)         #First few rows for each column of the data
The code above reads the Carseats data and stores it under the data object. The head() function returns the top six rows of this dataset. See the output for this code as below:
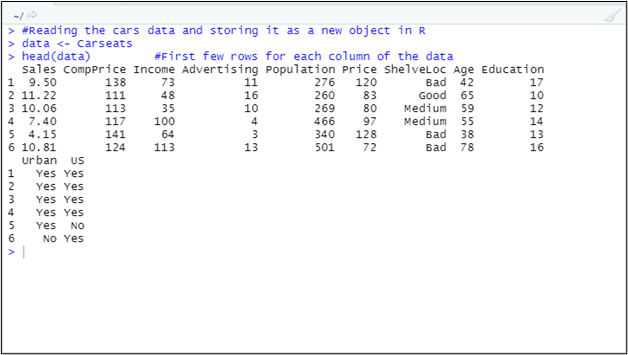
Here, this data represents the Carseats data for children seats for around 400 different stores with variables as below:
Sales: Unit sold (in thousands) at each store.
CompPrice: Price charged by a competitor at each location
Income: income of the group of competitor (in thousand dollars)
Advertising: Budget for advertising for the company (in thousand dollars)
Population: Population of the region (in thousands)
Price: Price being charged for each seat by the company
ShelveLoc: Measures the quality of car seats at shelving locations (Bad, Medium, Good). A factor.
Age: Average age of the population at each location.
Education: level of education of people at each location
Urban: Indicates whether the store is in an urban area or not. A factor with two values, Yes and No.
US: Country in which the store is placed. A factor with two values Yes and No.
Here, we will use the tree package to generate the decision tree, which helps us get information about the variables that affect the Sales variable more than others.
As our core objective is aligned to the Sales variable, let us see its distribution using the hist() function.
#Looking at the distribution of the Sales variable

hist(data$Sales)
If you run this code, you can see a histogram as shown below:
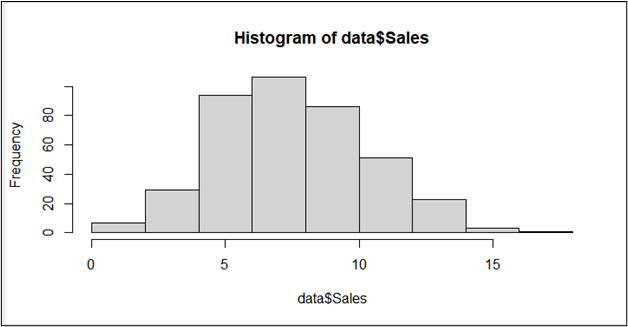
If you see the graph carefully, you can see the graph is centered around sales value 8 and is approximately normally distributed. We need to convert this numeric Sales data into a binary (yes, no type).
We will create a new variable that takes a binary value “yes” if the sales value is greater than or equals to 8. If it is not, the variable will take a binary value “no.” This new variable will be named Sales_bin, and we will drop the original Sales variable.
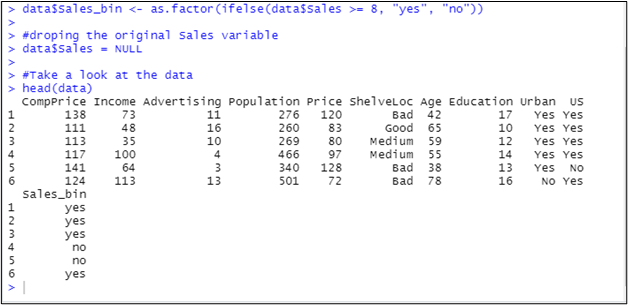
#creating Sales_bin based on the Sales variable

data$Sales_bin <- as.factor(ifelse(data$Sales >= 8, "yes", "no"))

#droping the original Sales variable

data$Sales = NULL

#Take a look at the data

head(data)
Let us see the output of this code:
The important part of any statistical analysis is creating two portions of your data. One is training data; the other is testing data. We basically train the model on training data, and then before deploying it, we test it on testing data. The standard ratio to divide a model into training and testing data is 70: 30. Meaning, we use 70% of the data to train a model and use 30% of it to test the model. Let us split our data into training and testing models with the given proportion. Remember that this split needs to happen randomly. We will use a combination of a sample() and rm() functions to achieve randomness.
set.seed(200)
#Developing the model
train_m <- sample(1: nrow(data), nrow(data)*0.70)
#Making the split
Train_data <- data[train_m,]
Test_data <- data[-train_m,]
rm(data, train_m)
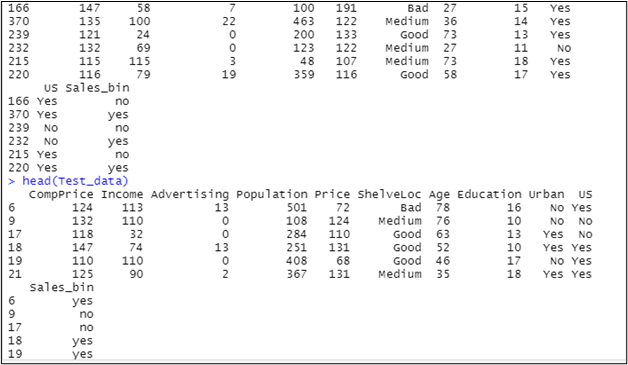
head(Train_data)
head(Test_data)
See the output for this code as below:
Now, the time is to run the decision tree model, which is a part of the tree package in R.
We will use the tree() function to generate a tree on the training dataset and use the same tree on the testing dataset to predict the values for the future. See the example below:
#Training the decision tree

Des_tree_model <- tree(Sales_bin~., Train_data)

plot(Des_tree_model)

text(Des_tree_model, pretty = 0)

#Using the model on testing dataset to check how good it is going

Pred_tree <- predict(Des_tree_model, Test_data, type = "class"

mean(Pred_tree != Test_data$Sales_bin)
Here, we have created the decision tree model on the Sales_bin variable from Train_data. We have also used the plot function to plot the decision tree. See the image below, which shows the decision tree generated.
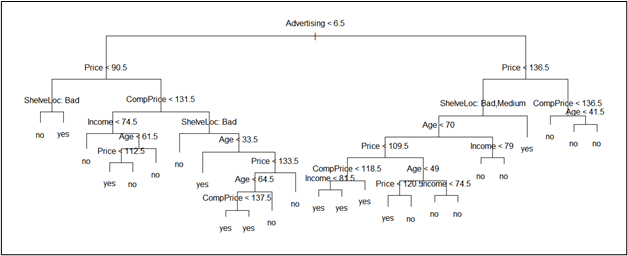
After this, we tried to use this model on testing data to generate the prediction. And finally, we have used the mean() function to get the percentage error value the predicted tree generates on the testing dataset.
See the output below for a better realization:
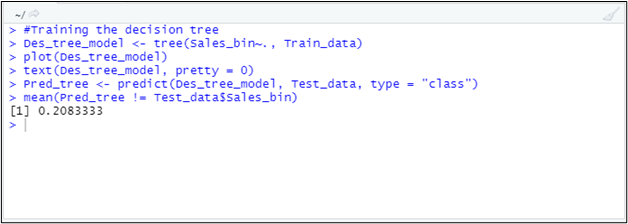
This image shows that around 21% of observations from the predicted decision tree are not matching with the actual data. In other words, there is a 21% error in the model, or the model is 79% accurate. For the sake of this example, it is a huge achievement, and I will be using the predictions made by this model.
Note: One thing to remember, since the split of training and the testing dataset was made randomly, the final results obtained by you while actually practicing on the same data, will be different at different times. I don’t expect the same accuracy which I got (Slight here and there, you know).
This article ends here. Where we used the tree package to generate, analyze, and predict the decision tree.
Let us wrap things up with a few Conclusion
Conclusion
- The tree package in R could be used to generate, analyze, and make predictions using the decision trees.
- The tree() function under this package allows us to generate a decision tree based on the input data provided.
- It is always recommended to divide the data into two parts, namely training and testing.
- The general proportion for the training and testing dataset split is 70:30.
Recommended Articles
This is a guide to R Tree Package. Here we discuss the tree package in R, how to install it, how it can be used to run the decision, classification, and regression trees with hands-on examples. You may also have a look at the following articles to learn more –
