Updated May 25, 2023
Introduction to R Data Types
R data types are the basic features of R language used to accept and store various data types. R language supports commonly used primitive or Scalar data types such as char, integer, double, logical, and complex data types that accept and process as a single data value at a time. Also, R language supports vectors that can hold similar data types of one-dimensional. The matrix data types, lists, data frames, and arrays are for two or multidimensional data formats. There are built-in keywords and functions available in the R language to declare each data type and assign values to the variable related to the data types.
Explain R Data Types
R programming supports various data types like scalars, matrices, lists, vectors,s, and data frames. Everything in R is considered an object, which means it stores and processes operations on objects). The key feature of R is a different process with different types of objects. Most of the commands in R involve applying functions to the objects. Variables do not require a declaration; instead, assigning a sequence of numbers to the vectors can be done.
Let’s learn the types one by one:
1. Vector
Vector has a set of values with the same types (collection of ordered elements) represented in one dimensional. The class of the vector is determined by the type of entries made. When a vector is created for more than one element, the c () function concatenates all the elements together in a single vector. Vectors are a string of numeric, sequential numbers or random numbers. Vector varieties are the character, integer, numeric, complex, and logical (true, false). These are implicit conversions. Some function fives vector functions are length(), class(x), and is.logical(x) , is.null , rep().
Example
Below, we can see basic vector examples:
- Vector Arithmetic: Numeric vectors are performed in arithmetic expressions to do calculations to give another vector. Statistical operations are also done, giving entries like max, min, and var mean.
Code:
y <-c (1, 2 ,2.5 ,3)

y +2
Output:
![]()
The above statement gives the output using the c() function, which adds variable t to 2.
- The length of the vector is calculated by the len () function.
Code:
len (y)
Output:
![]()
- Logical Vectors: Comparison of two numbers with logical values like True, false, and NA. Logical operators to satisfy certain conditions include <, <=, >, >=, ==, != for inequality.
Example #1
Code:
v <- seq ( -2 ,2)

l < -v > 0

l
Output:
![]()
Example #2
Code:
x=c (3,6,1,2)

x>2
Output:
![]()
Code:
rep () – to create replicate values.

rep(1,3)

rep( 3:6 ,2)

rep( 1:3 , each =2)

rep(1:3 , times=2 ,each =2)
- Create a Vector
Code:
color <- c (‘blue’, ‘pink’, ‘white’)

print (color)
- To display the class of the vector
Code:
print ((class (color))
Output:
![]()
In the above program [1], this one denotes the first element of the vector.
2. Factor
The factor adds numeric codes along with the character level. In simple, it defines categorical data with ordered and unordered sets. They are defined using function factor (). Storing data in a factor helps to store data efficiently in statistical modeling.
Example #1
Code:
f = factor (c(1, 6,2,4,7,1,6,7,8)

print (f)
Output:
![]()
Example #2
Code:
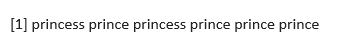
k = factor (c( 2,0,2,0,0,0 ) , levels =c(0,2) , labels =c( “ prince “ ,”princess”))

k
Output:
3. Matrix
In R programming matrix is a two-dimensional element with numeric and character vectors, simply an atomic vector with the number of rows and columns. Three ways to create a matrix are using the function matrix(), converting the vector into the matrix, and binding vectors. Some useful functions here are :
- rbind() and cbind(): Combines or binds columns and rows.
- dim(): Setting dimensions.
Syntax:
variable <- matrix(vector, n rows, n columns, split by row or column)
If true, it splits by row, and columns split false returns.
Example #1
- Consider a matrix.
Code:
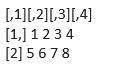
x = matrix(c (1,2,3,4,5,6,7,8) 2,4, true)

print (x)
Output:
Example #2
- Considering Bind.
Code:
a <- 1:4
b<- 10 :13
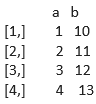
cbind( a,b)
a b
Output:
4. List
List stores Objects and the elements can be a character, matrices, arrays, or numeric. it may consist of another list as an item too.
Syntax:
variable <- list (list items)
Example of an R list:
Code:
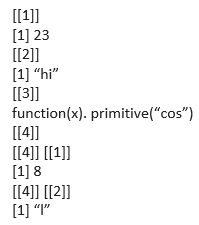
lak = list (23, “hi”, cos, list (5L,” l”))

print (lak)
Output:
Example Considering copies of three Vectors:
Code:
a =c(3,5,6)

b =c(“aa”,”cc”,”ee”)

x=c (true, false, true)

y=list(a,b,x)
Therefore y holds the copies of a,b,x.
5. Data Frame
Data frames are two-dimensional with a group of vectors of an equal length. It’s a special kind of list with a rectangular format list. The key factor is to store data tables. They are created using function data. the frame ().
Syntax:
variable <- data.frame ( list 1, list 2… list N)
Example #1
Let’s see an example of the data frame In R.
Code:
X= data.frame( values =c(20,50,10), name =c(‘ Gri’,’Tom’,’jeff’))

print(X) values Name
Output:

Even we can use built-in data frames. In which the top element defines a header, followed by data rows and columns. To see the preview, we can use the head function before.
Example #2
Code:
computer

Date  intel    speed   data

hp   1990    8081   MHZ    8

acer    2001    80286 Mhz     16
To define the class of the intel:
computer [[‘intel’]]
Output:
![]()
Conclusion
In this article, we have reviewed different R data types used in programming. To make any application, we need variables to store the values, and all these variables are necessary to assign data types. These data types are used in data analysis. Understanding data types help while debugging for computational purposes.
Recommended Articles
This is a guide to R Data Types. Here we discuss the introduction and different R data types with examples. You can also go through our other related articles to learn more –
