Updated August 22, 2023
PowerPivot in Excel (Table of Contents)
Introduction to PowerPivot in Excel
PowerPivot is a popular Add-In under Microsoft Excel, which can be used to import data sets with millions/trillions of rows from different sources and help us do quick data analysis with large data sets under excel in a jiffy. This add-in was first introduced under Microsoft Excel 2010 and made as a native feature under 2013 onwards versions of Excel and Office 365 as well. The power that PowerPivot posses lie in the data models of its own, which can be considered as databases. The data models are nothing but data tables similar to those we use in SQL. We can slice and dice with these data tables. Create relationships between them, combine different data tables, create calculated columns for advanced analysis and, obviously, the advanced reporting as well. We can consider it as a pocket database under Microsoft Excel and ideally in the hands of users as well.
How to Activate PowerPivot Add-ins Under Excel?
Power Pivot is a feature in Excel that enables you to import millions of rows of data from multiple data sources into a single Excel workbook.
Let’s look at the below steps:
Step 1: Open an Excel file. Click on the File tab at the upper Excel worksheet ribbon. Go to Options there.

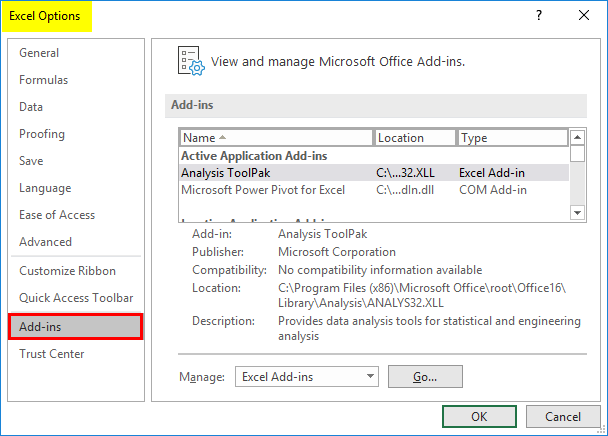
Step 2: Once you click the Options button, you will see a new window, “Excel Options“, with a list of different Excel options. You have to click the Add-ins option from that list to access all the add-ins in Excel.
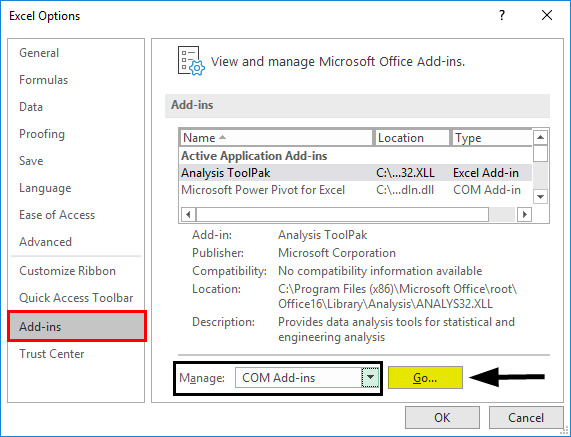
Step 3: On the below side of this window, you’ll see the Manage: section dropdown. In that dropdown, select COM Add-ins and click on the GO button.
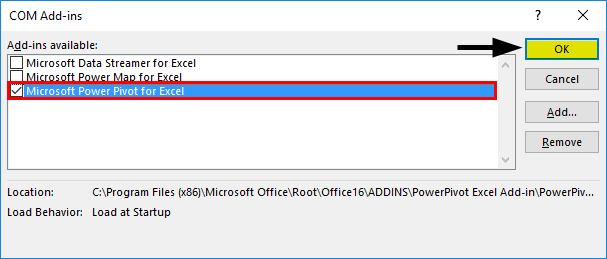
Step 4: A COM Add-ins dialog box will open up. There, select Microsoft PowerPivot for Excel and click on the OK button.
Once you enable this add-in, you can see a new option added up in the Excel ribbon called PowerPivot, as shown in the image below:
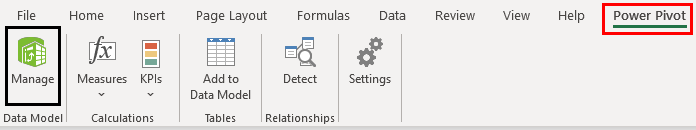
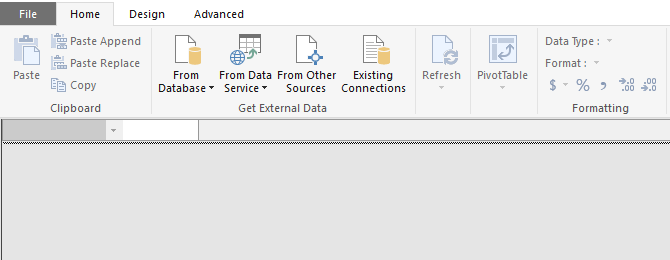
To launch the PowerPivot, click on the Manage option under the Data Model section in the PowerPivot tab. The PowerPivot window looks like the one in the image below:
Importing Datasets Under PowerPivot:
We can import data from multiple resources under power pivot, which makes it awesome to work on. It allows you to import data from SQL, ORACLE DB, MongoDB, Azure, Access, Teradata, Sybase, etc. At the same time, you can import data through .xls/xlsx and .txt files. We will try to import a text data file under PowerPivot.
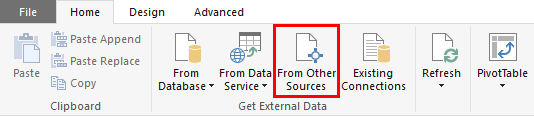
Step 1: Under PowerPivot for the Excel sheet, click the From Other Sources button in the Get External Data section. It will open up a series of external sources from where you can fetch the data under PowerPivot.
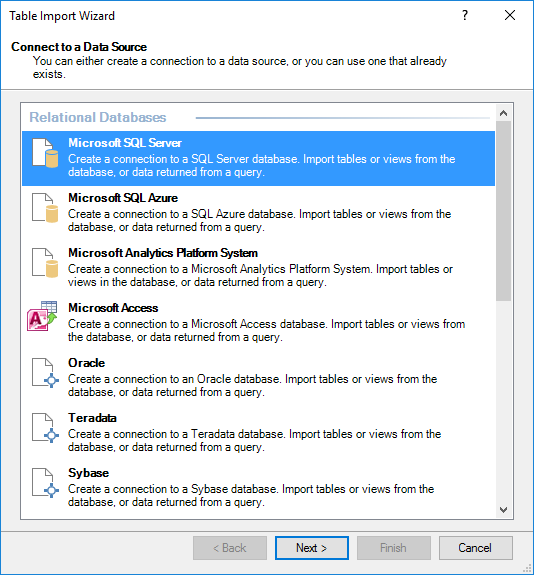
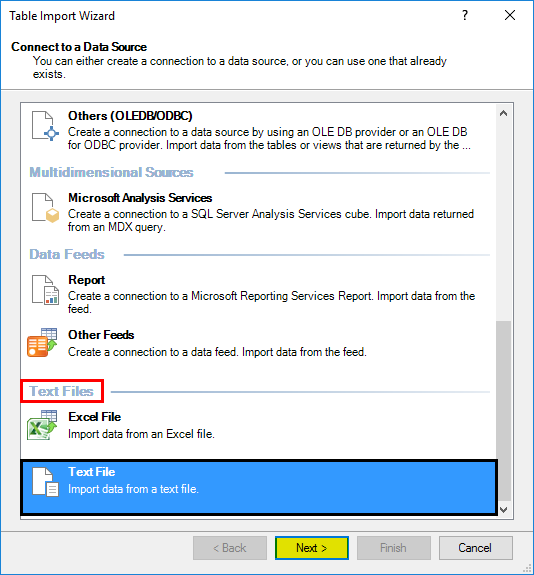
Step 2: Navigate to the end through the scroll bar, and there you can see an option to import data from a text file. Click on that option and hit the Next button.
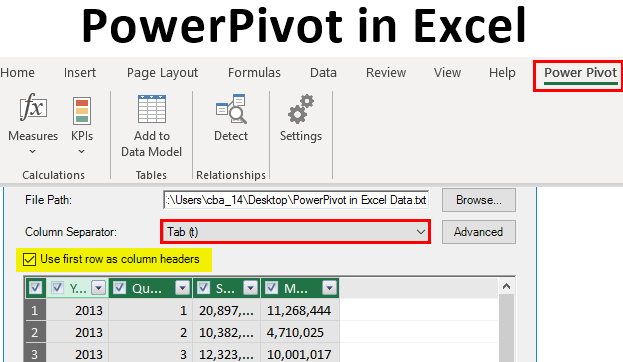
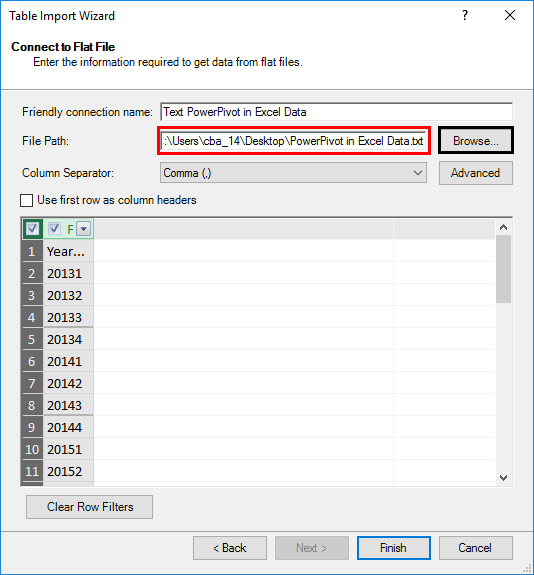
Step 3: On the next screen, you need to provide the path on which the text file containing data is physically located. I will mention the way where I saved the data file to import under the File Path option. Click on the Browse… button and navigate through the path.
Make sure you select Tab as a Column Separator and check the option for Use first row as column headers options.
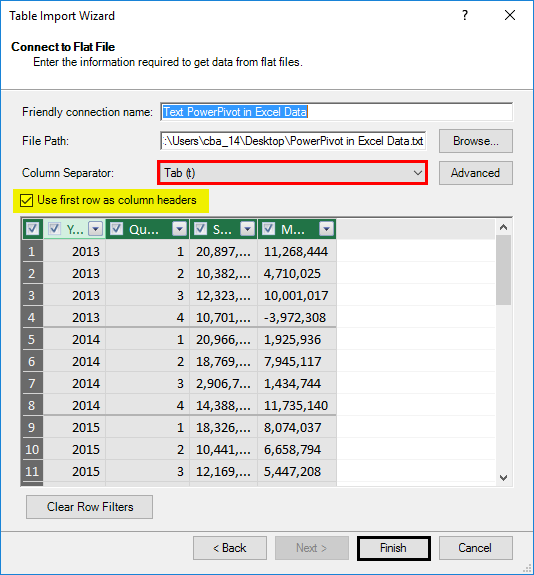
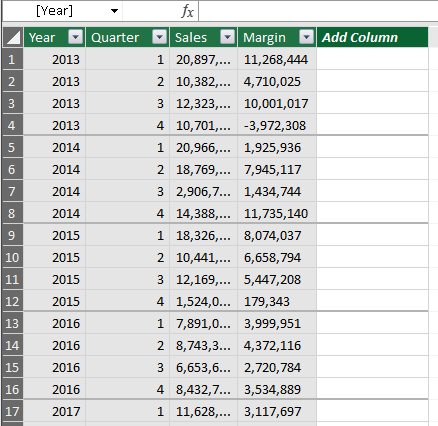
The first will allow the data to spread across different columns, and the second will consider the first row from your data as a column header. Click on the Finish button after this, and you will see data loaded under PowerPivot as below.
Adding Calculated Column under PowerPivot Data:
We can also add a calculated column under PowerPivot. Like in our example, we have Sales and Margin values using which we can compute the Margin% achieved and store it in the new column under PowerPivot. This happens the same way we do it in Excel.
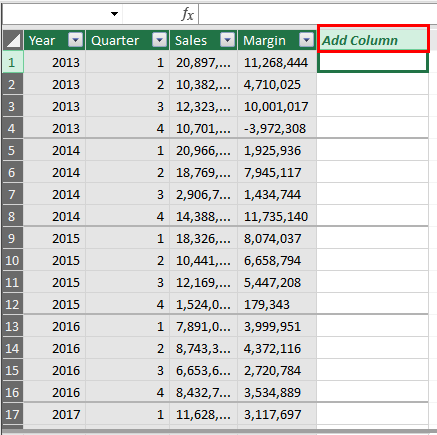
Step 1: You can see a blank “Add Column” column under PowerPivot after all your data columns. This column allows you to add some computed data to it.
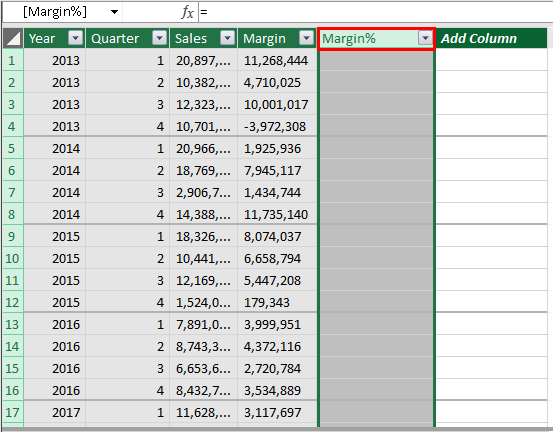
Step 2: Rename this blank column as Margin% by double-clicking the “Add Column” row. See the screenshot below.
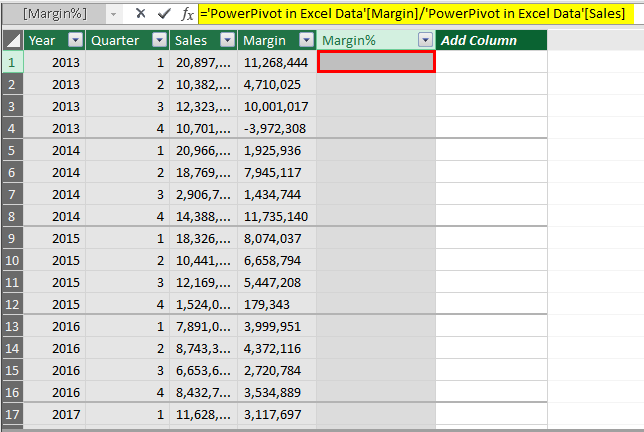
Step 3: Now, in the first cell of column Margin%, use the formula as Margin/Sales using Equals to sign. The formula structure in PowerPivot is somewhat different as it is nothing but a pivot table. See the screenshot below.
=’PowerPivot in Excel Data'[Margin]/’PowerPivot in Excel Data'[Sales]
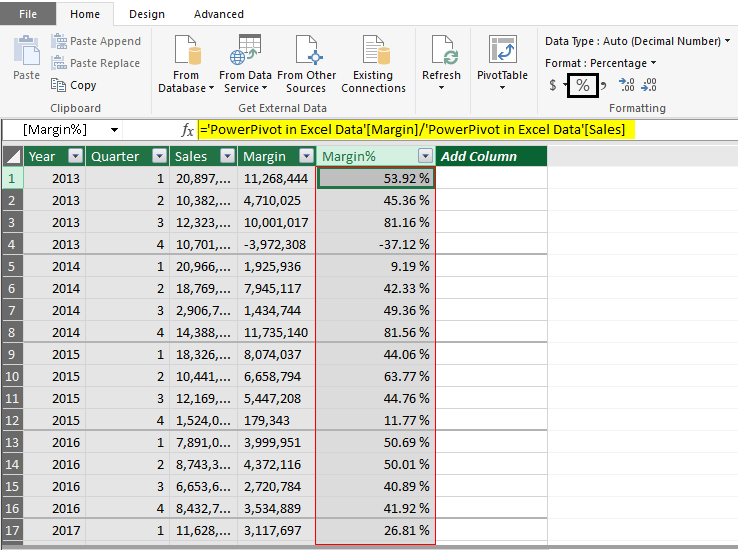
Step 4: Press the Enter key, and you can see all the active rows will be added with the same formula, and Margin% will be calculated.

Step 5: Now, format the Margin% column as % using the formatting tab in PowerPivot.
This is how we can add calculated columns under PowerPivot. This is the same as adding a computed column under Microsoft Excel.
Adding Pivot Table under PowerPivot:
We can add a pivot table under PowerPivot.
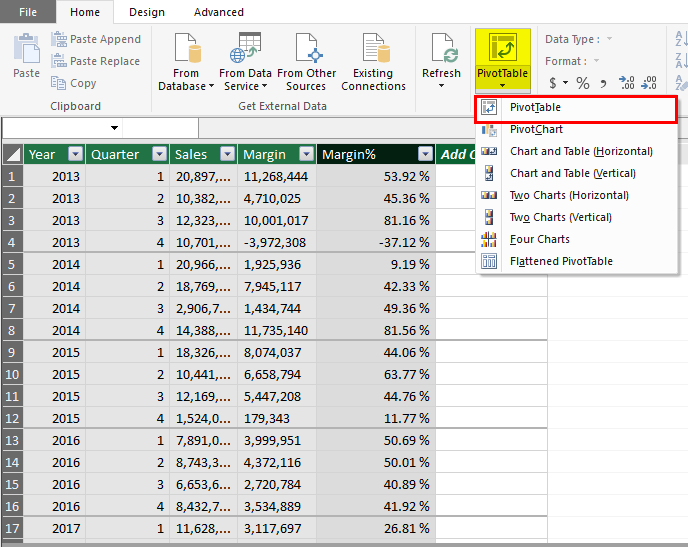
Step 1: Under the Home tab, present on the upper ribbon at the Pivot Table. There is one Tab called PivotTable. Click on that and select the PivotTable option.
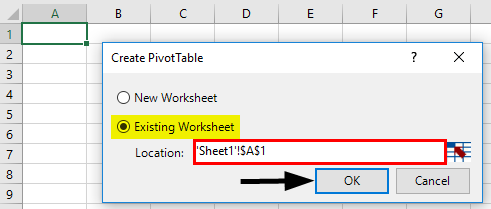
Step 2: You can see the Create PivotTable window once you click on the PivotTable option. You’ll have two options to create a pivot table on the same or a new worksheet. You must mention the cell reference if you create it on the same worksheet. Click OK once you choose the option of your choice. See the screenshot below.
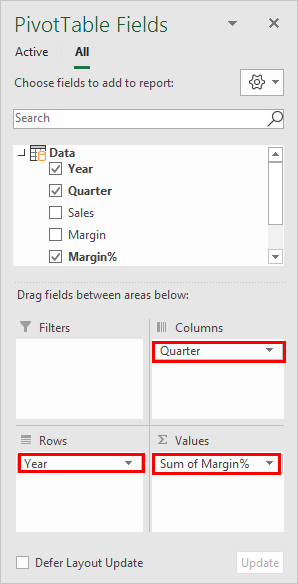
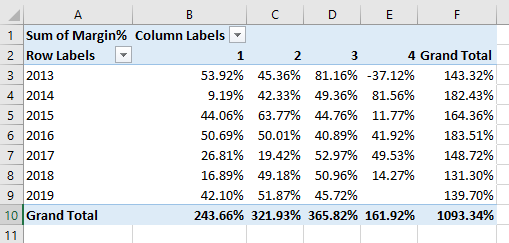
Step 3: Now, you can select the columns of your interest under the pivot table from the PivotTable Fields option pane on the right-hand side of the Excel file. I would like to check what is the quarter-wise Margin%. Therefore, I will select Years in Rows, Margin% in Values, and Quarters in the column.
This is it from this article on PowerPivot. Let’s wrap things up with some points to be remembered:
Things to Remember About PowerPivot in Excel
- It is mandatory to clean the data before you import it under PowerPivot. Use some Excel formulae, which are used to clean the Excel data. Ex. TRIM, LEFT, RIGHT, etc. Also, remove duplicates and convert numbers and dates into a proper format.
- When you import two or more tables in PowerPivot, it automatically creates the Data Model.
- You also can add calculated column fields in PowerPivot as same as those in Excel. PivotTable can also be added under PowerPivot.
Recommended Articles
This is a guide to PowerPivot in Excel. We discuss how to activate PowerPivot in Excel, practical examples, and a downloadable Excel template. You can also go through our other suggested articles to learn more –
