Excel Data Model (Table of Contents)
Introduction to Data Model in Excel
The data model feature of Excel enables the easy building of relationships between easy reporting and their background data sets. It makes data analysis much easier. It allows the integration of data from a plethora of tables spread across multiple worksheets by simply building relationships between matching columns. It works completely behind the scene and greatly simplifies reporting features such as PivotTable etc.
Our article shall attempt to show how to create a pivot table from two tables by employing the Data Model feature, thus establishing a relationship between two table objects and thereby creating a Pivot Table.
How to Create a Data Model in Excel?
Let’s understand how to create the Data Model in Excel with a few examples.
Example #1
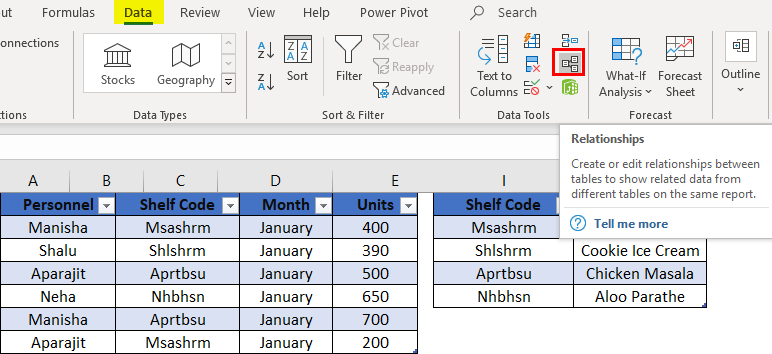
- We have a list of products, and we have a shelving code for each product. We need a table where we have the shelving description along with the shelving codes. So how do we incorporate the shelving descriptions against each shelving code? Perhaps many of us would resort to using VLOOKUP here, but we shall altogether remove the need to use VLOOKUP here using Excel Data Model.
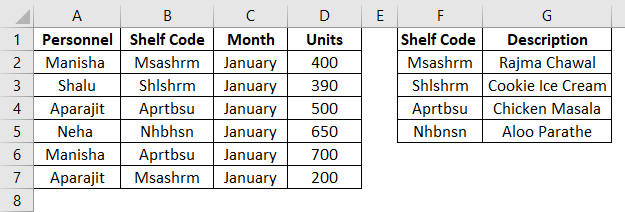
- The table on the left is the data table, and the table on the right is the lookup table. As we can see from the data, it is possible to create a relationship based on common columns.
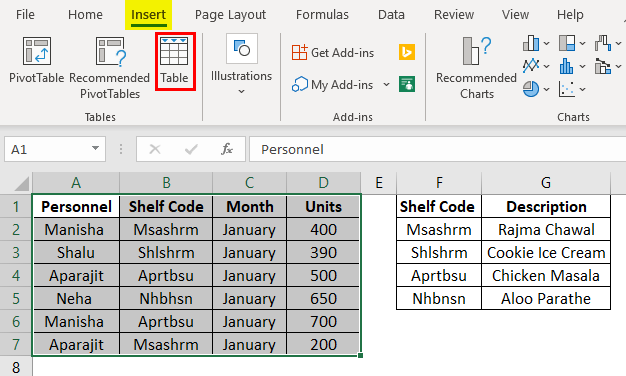
- Now, the Data Model is only compatible with table objects. So, it might be necessary sometimes to convert data sets to table objects. To do that, follow the below steps.
- Left-click anywhere in the data set.
- Click the Insert tab and navigate to Table in the Tables group or simply press Ctrl+T.
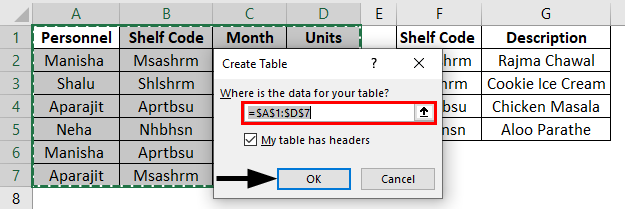
- Uncheck or check the My Table has the Header option. In our example, it does indeed have a header. Click OK.
- While still focused on the new table, we need to provide a name that is meaningful in the Name box (towards the left of the formula bar).
In our example, we have named the table Personnel.
- Now we need to do the same process for the lookup table as well and name it Shelf Code.
Creating a Relationship
So firstly, we shall go to the Data tab and then select Relationships in the Data Tools subgroup. After we click on the Relationships option, in the beginning, since there is no relationship, hence we will have nothing.
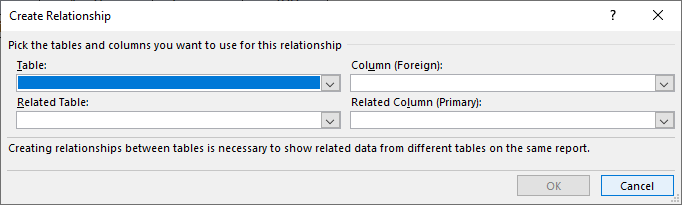
We will first click on New to create a relationship. We will now need to provide the primary and the lookup table names from the drop-down list and then also mention the column which is common between the two tables so that we can establish the relationship between the two tables from the drop-down list of columns.
- Now, the primary table is the table that has the data. It is the primary data table – Table5. On the other hand, the Related table is the table that has the lookup data – it is our lookup table ShelfCodesTable. The primary table is the one that is analyzed based on the lookup table, which contains lookup data that will make the reported data, in the end, more meaningful.
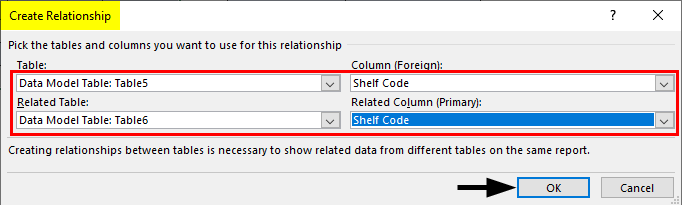
- So, the common column between the two tables is the Shelf Code column. This is what we have used to establish the relationship between the two tables. Coming to the columns, the Column (foreign) is the one that refers to the data table where there can be duplicate values. On the other hand, the Related Column (primary) refers to the column in the lookup table where we have unique values. We are simply setting up the field to lookup values from the lookup table in the data table.
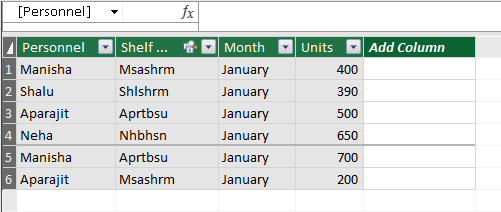
- Once we set this up, Excel would create a relationship between the two behind the scene. It integrates the data and creates a data model based on the common column. This is light on the memory requirements and much faster than using VLOOKUP in large workbooks. After defining the Data model, Excel would be treating these objects as Data Model tables instead of a worksheet table.
- Now to see what Excel has been up to, we can click on Manage Data Models in Data -> Data Tools.
- We can also get the diagrammatic representation of the data model by changing the view. We will click on the View option. This will open up the view options. We will then select the Diagram View. Then we will see the diagrammatic representation, showing the two tables and the relationship between them, i.e. the common column – Shelf Code.
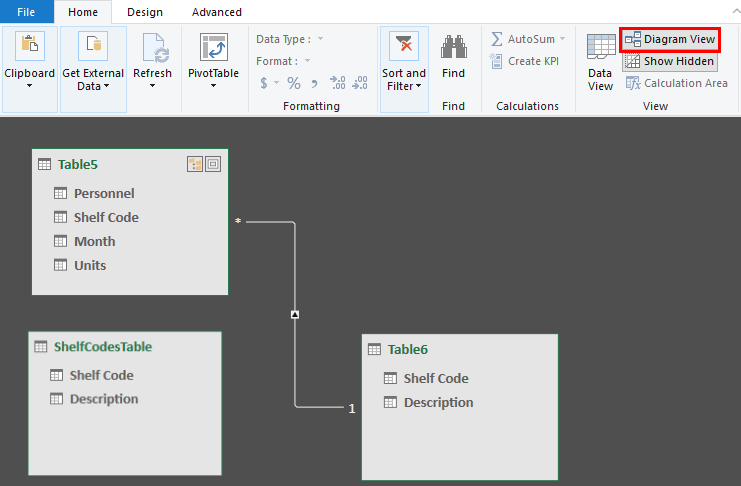
- The diagram above shows a one-to-many relationship between the unique lookup table values and the data table with duplicated values.
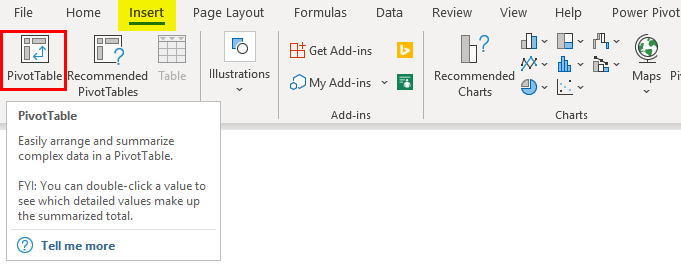
- Now we will have to create a pivot table. To do that, we will go to the Insert tab and then click on the Pivot Table option.
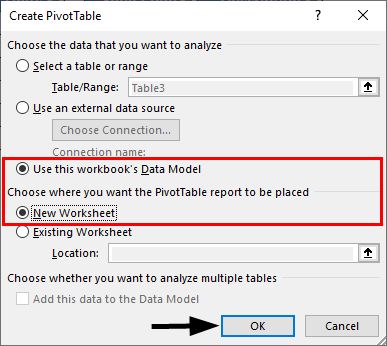
In the Pivot table’s Create Pivot Table dialogue box, we will select the source as “Use this workbook’s Data Model”.
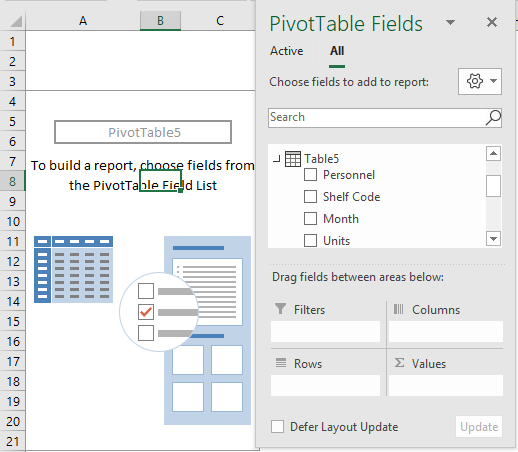
- This will create the Pivot table, and we can see that both the source tables are available in the source section.
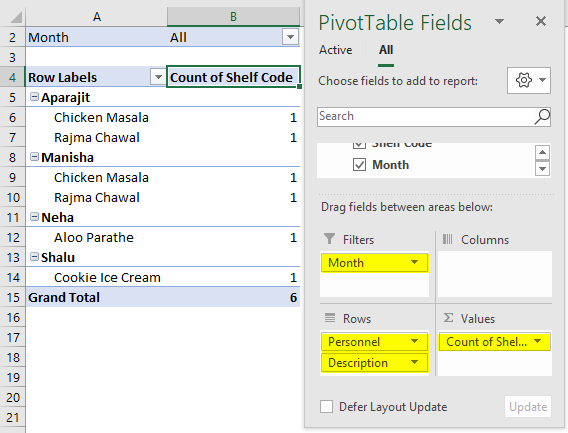
- Now we shall create a pivot table showing the count of each person who has shelved items.
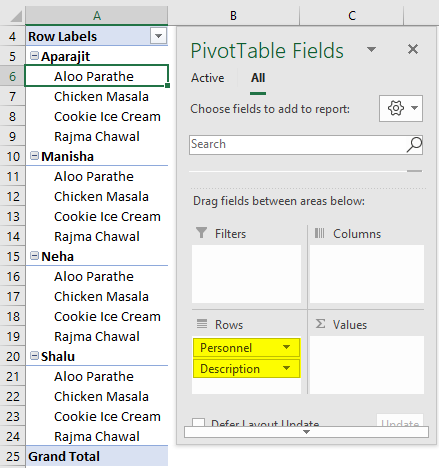
- We will select Personnel in the Rows section from Table 5 (data table), followed by Description (lookup table).
- Now we shall drag the Shelf Code from Table 5 into the Values section.
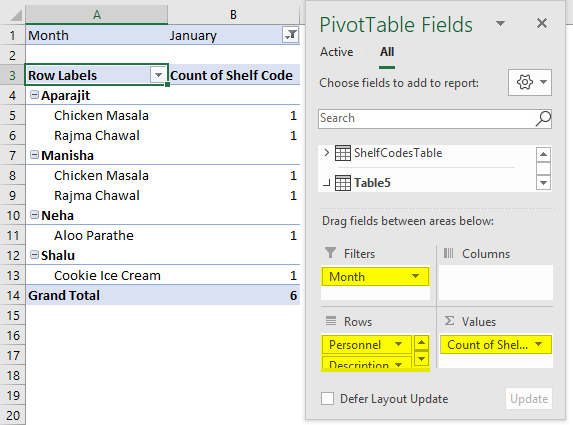
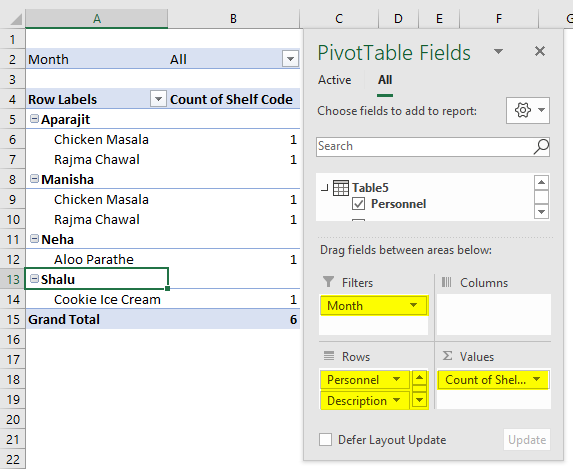
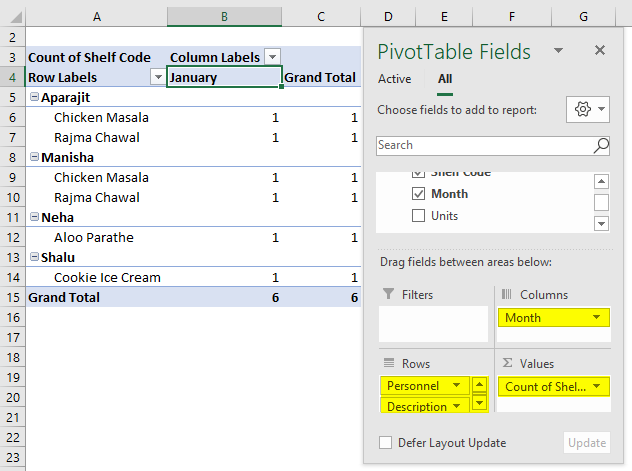
- Now we shall add Months from Table 5 to the Rows section.
- Or we could add the months as a filter and add it to the Filters section.
Example #2
- We now have Mr Basu running a factory called Basu Corporation. Mr Basu is trying to estimate the revenue for 2019 based on the data from 2018.
- We have a table where we have the revenue for 2018 and the subsequent revenue at different incremental levels.
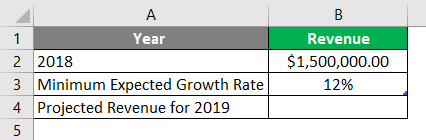
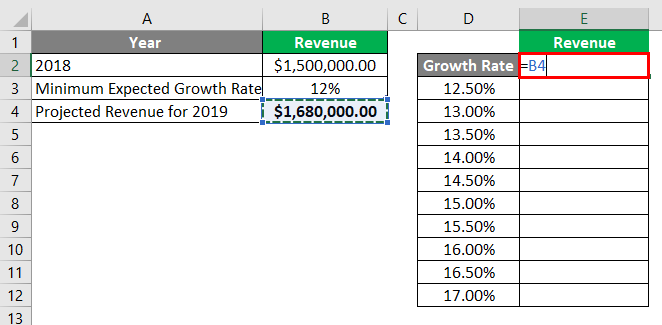
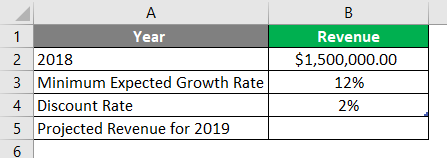
- So, we have the revenue for 2018 – $1.5 M, and the minimum growth expected the following year is 12%. Mr Basu wants a table that will show the revenue at different incremental levels.
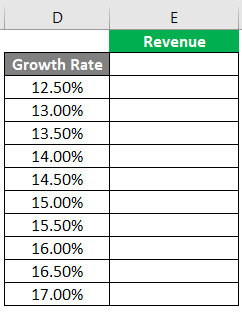
- We will create the following table for the projections at different incremental levels for 2019.
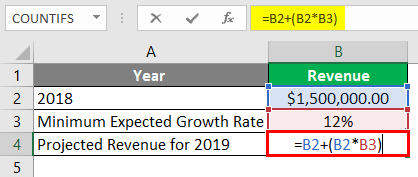
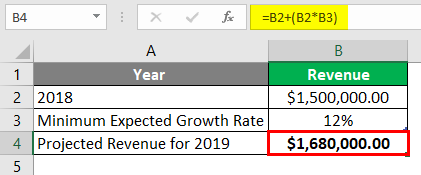
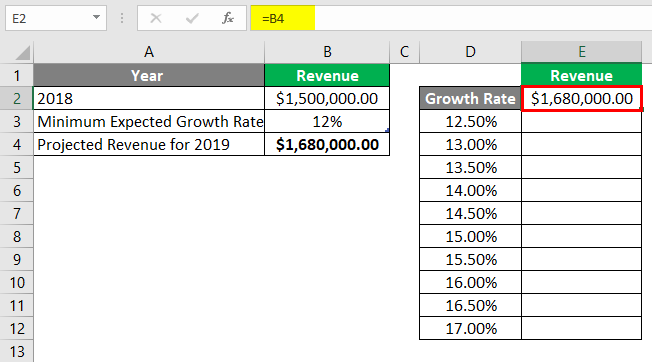
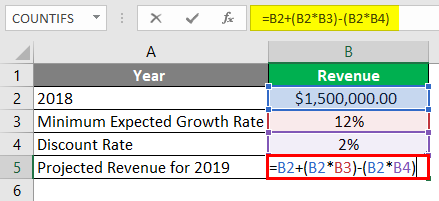
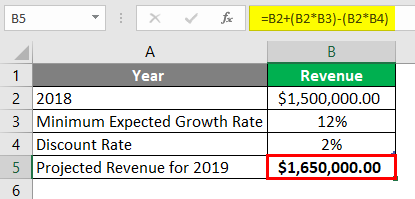
- Now we shall give the first Revenue row a reference to the estimated minimum revenue for 2019, i.e. $1.68 M.
- After using the formula, the answer is shown below.
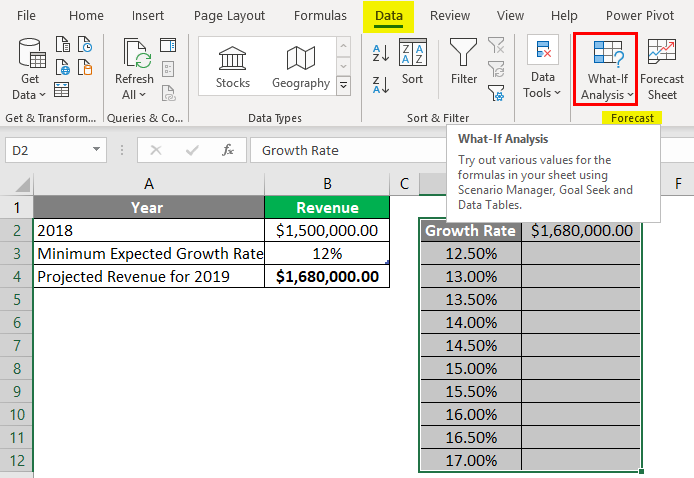
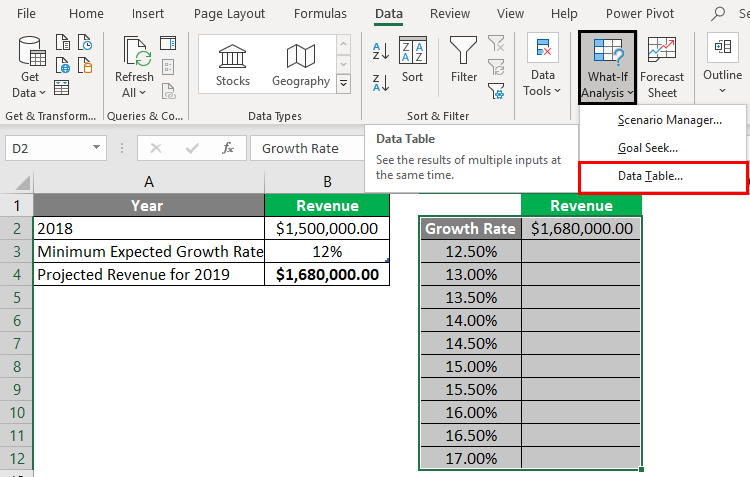
- Now we shall select the entire table, i.e. D2:E12 and then go to Data ->Forecast ->What-If Analysis ->Data Table.
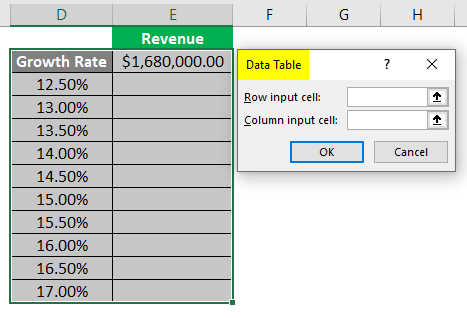
- This will open up the Data Table dialog box. Here we shall enter the minimum increment percent from cell B4 in the Column Input cell. The reason for that is that our projected estimated Growth percentages in the table are arranged in a columnar fashion.
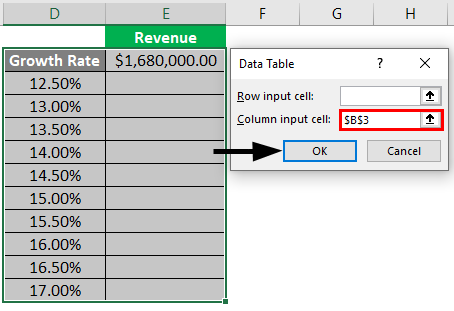
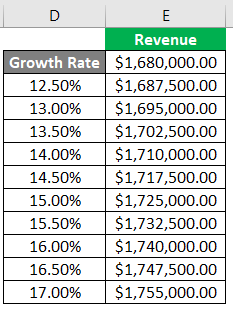
- Once we click OK, the What-If Analysis will automatically populate the table with projected revenue at the different incremental percentages.
Example #3
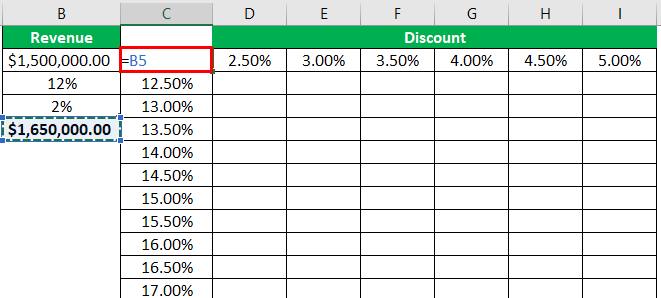
- Now suppose we have the same scenario as above, except that now we also have another axis to consider. Suppose, in addition to showing the projected revenue in 2019 based on the data of 2018 and the minimum expected growth rate, we now also have the estimated discount rate.
- First, we shall have a table shown below.
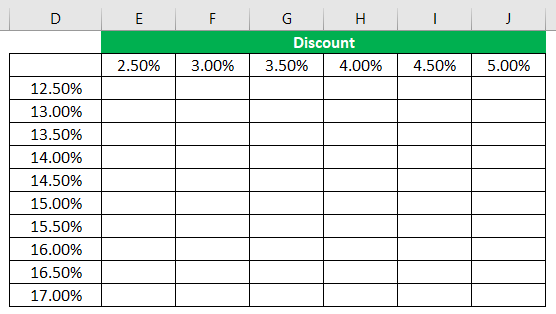
- Now we shall give reference to the minimum projected revenue for 2019, i.e. cell B5 to cell D8.
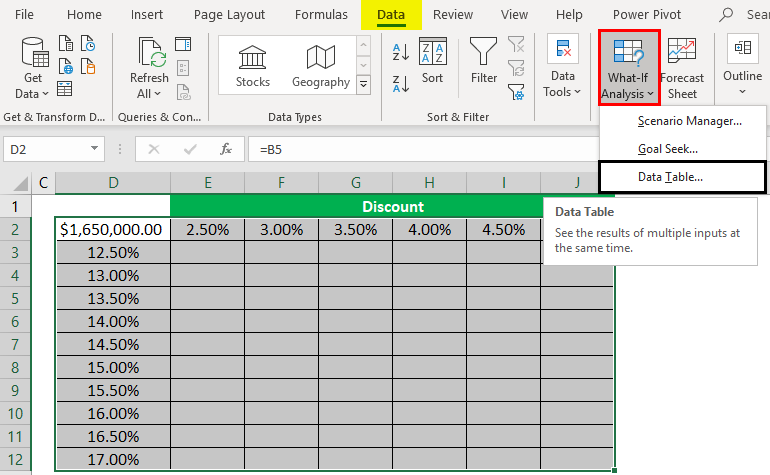
- Now we shall select the entire table, i.e. D8:J18 and then go to Data ->Forecast ->What-If Analysis ->Data Table.
- This will open up the Data Table dialog box. Here we shall enter the minimum increment percent from cell B3 in the Column Input cell. The reason for that is that our projected estimated Growth percentages in the table are arranged in a columnar fashion. We shall now also additionally enter the minimum discount percent from cell B4 in the Row Input cell. The reason for that is that our projected discount percentages in the table are arranged in a row-wise fashion.
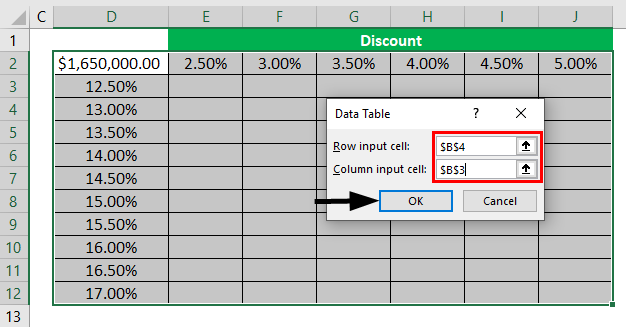
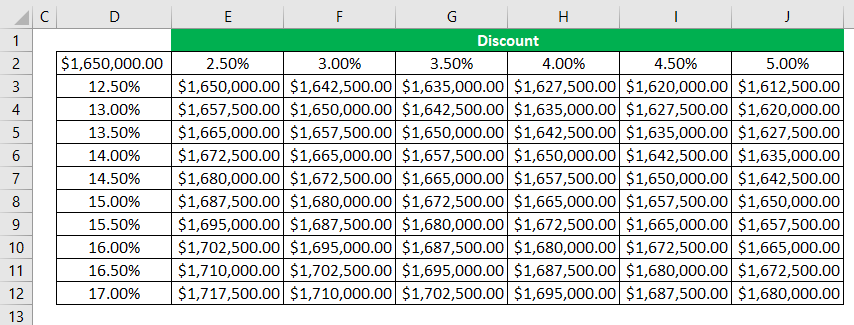
- Click OK. This will make the What-If Analysis automatically populate the table with projected revenue at the different incremental percentages as per the discount percentages.
Things to Remember About Data Model in Excel
- Upon successfully calculating the values from the data table, a simple Undo, i.e. Ctrl+Z, will not work. It is, however, possible to manually delete the values from the table.
- It is not possible to delete a single cell from the table. It is described as an array internally in Excel; hence we will have to delete all the values.
- We need to properly select the Row Input Cell and the Column Input Cell.
- The data table, unlike the Pivot Table, doesn’t need to be refreshed every time.
- Using the Data Model in Excel, we can improve performance and go easy on memory requirements in large worksheets.
- Data Models also makes our analysis much simpler as compared to using a number of complicated formulae all across the workbook.
Recommended Articles
This is a guide to Data Model in Excel. Here we discuss how to create Data Model in Excel along with practical examples and a downloadable excel template. You can also go through our other suggested articles –
