Updated December 16, 2023
Difference Between Power BI vs Tableau vs Qlik
Power Bi is a Business Intelligence tool we can upload and publish data throughout our companies. Business Intelligence responds to any query and improves decision-making. Adding power to the business for good visualization of data. Another feature of Power BI Is Quick Insights is that we can search a dataset for interesting patterns and provide a list of charts to understand data better. It uses artificial intelligence and data mining to analyze the data. Qlik is also a Business Intelligence and data visualization tool.
It is an end-to-end ETL solution yielding good customer service. With qlik, we can create a flexible end-user interface, make good presentations based on the data, create dynamic graphical charts and tables, perform statistical analysis, and build our own expert systems. Qlik can be used with the virtual database. It is a window-based tool that requires the following components: Qlik Server and Qlik Publisher.
They are the most popular Business Intelligence tool to create, display, and share interactive reports with users anytime. They are platform-independent and require fewer technical experts to work with. They work on Client-Server architecture for speedy deployments. They are perfectly suitable for top management employees who need good BI. Tableau has the advantages of fast access, interactive visualization, cost-effectiveness, and Maintaining good security.
Features of Power BI
- Rich Graphical visualizations from complex BI data.
- Ad-hoc Reporting
- Good Navigation Pane
- Includes a dataset with customizable dashboards.
Features of Qlik
- Using a hybrid approach, the user can associate data stored within big sources stored within the Qlik view in-memory dataset.
- With the help of direct discovery, they allow users to perform Business discovery and visual analysis.
- Mobile-ready Roles and Permissions
- Interact with dynamic apps and dashboards.
Features of Tableau
- They have a good drag and drop.
- For data sharing, they use Tableau Public.
- They implement interactive data visualizations on the web.
- Their performance is strong and reliable and they operate on huge data.
- They are mobile-friendly and support full online versions.
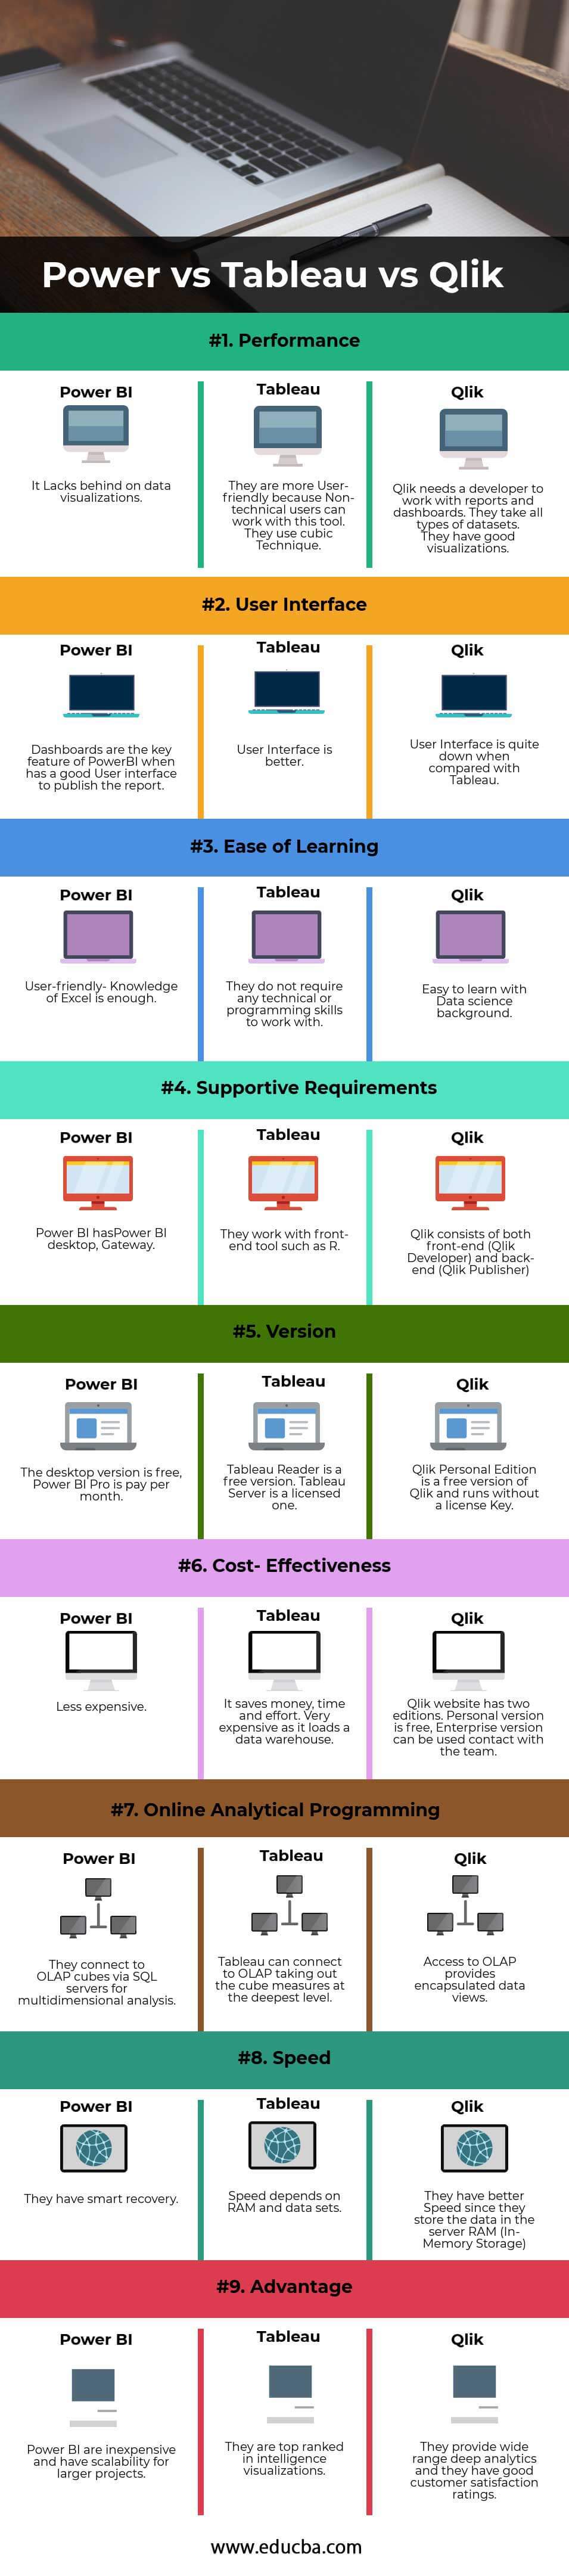
Head To Head Comparison Between Power BI and Tableau and Qlik(Infographics)
Below is the top 9 difference between Power BI vs Tableau vs Qlik
Key Differences Between Power BI and Tableau and Qlik
These are popular choices in the market; let us discuss some of the major differences:
- Multiple users can immediately access Qlik. Qlik is faster than Tableau. Power bI connects to any data source they do not require ETL.
- Qlik Views stores documents in the .qvw format, and access to these documents is possible through Qlik Views’ proprietary communication protocol. The Windows OS stores the files, and the Qlik Server manages all events in the system, functioning as the Client-Server interface. Power BI, on the other hand, utilizes three types of files: Excel (.xls), Power BI Desktop (.pbix), and CSV (.csv). Tableau extract files can have (.tde) file extensions.
- Qlik Supports the OLEDB interface for external data sources. Power BI loads the data from OLEDB and publishes it in the BI Server. At present, they support only Live Connection.
- Qlik poorly manages its structure, whereas Tableau effectively manages it in a user guide.
- Qlik works as a standalone technique. Publishing the data to the outside world is managed by QlikView Publisher. Power BI is available only on the SAAS model, whereas Tableau has cloud and on-premises options. The Power BI desktop version is free.
- PowerBI enhances data modeling facilities, while Qlik rapidly generates data insights.
- Tableau and Power BI are user-friendly. Qlik has highly customizable patterns.
- Qlik and Tableau work for statistical analysis. Power BI does not have this capability.
Power BI vs Tableau vs Qlik Comparison Table
Below is the 9 top most comparison
| The basis of comparison | Power BI | Tableau | Qlik |
| Performance | It Is behind on data visualizations. | They are more User-friendly because non-technical users can work with this tool. They use the cubic Technique. | Qlik needs a developer to work with reports and dashboards. They take all types of datasets.
They have good visualizations. |
|
User Interface |
Dashboards are the key feature of PowerBI when it has a good User interface to publish the report. |
User Interface is better. |
User Interface is quite down when compared with Tableau. |
|
Ease of learning |
User-friendly- Knowledge of Excel is enough |
They do not require any technical or programming skills to work with. |
Easy to learn with a Data science background. |
|
Supportive requirements |
Power BI has a Power BI desktop, Gateway. |
They work with front-end tools such as R.
|
Qlik consists of both front-end (Qlik Developer) and back-end (Qlik Publisher) |
|
Version |
The desktop version is free; Power BI Pro is paid per month. | Tableau Reader is a free version. Tableau Server is a licensed one. | Qlik Personal Edition is a free version of Qlik and runs without a License Key. |
| Cost- Effectiveness | Less expensive. | It saves money, time, and effort. Very expensive as it loads a data warehouse. | Qlik website has two editions. The personal version is free, and the Enterprise version can be used to contact the team. |
| Online Analytical Programming | They connect to OLAP cubes via SQL servers for multidimensional analysis. | Tableau can connect to OLAP, taking out the cube measures at the deepest level. | Access to OLAP provides encapsulated data views. |
| Speed | They have smart recovery | Speed depends on RAM and data sets. | They have better Speed since they store the data in the server RAM (In-Memory Storage) |
| Advantage | Power BI is inexpensive and has scalability for larger projects. | They are top-ranked in intelligence visualizations. | They provide a wide range of deep analytics, and they have good customer satisfaction
ratings. |
Conclusion
Deciding which one is the best needs analysis. The drag-and-drop capabilities and secure data connections make Tableau a front-runner in the market. Qlik’s strengths include in-memory engine capabilities for visualizing patterns. Reports created through Power BI can be shared across teams and accessed on any device. Overall, Power BI emerges as the competitor’s tool among the three tools. It is a high-level Microsoft application and platform with advanced cloud platform support. Tableau is the preferred choice in the current market of business analysis.
Recommended Articles
This has guided the top differences between Power BI vs Tableau vs Qlik. Here, we also discuss the key differences between infographics and comparison tables. You may also have a look at the following articles to learn more.
