Updated May 5, 2023
Differences Between Power BI vs Tableau
Microsoft Power BI is a business Intelligent Tool that handles data from different sources and provides visualization after cleaning and integration. It enables Adhoc report generation and helps in the analysis of the data. Practical and easily understandable Dashboards are generated and can be published online. It can be used by naïve users to experienced users. It is used to run Adhoc queries to identify patterns and trends.
Tableau is a business intelligence tool with an appealing user interface to generate reports, dashboards, and massive data analysis from multiple sources. It provides interactive data visualization to understand the data and make insights. It makes the users understand the data without technical knowledge and enables understanding of any complex process in a simple and efficient approach.
Head-to-Head Comparison Between Power BI vs Tableau (Infographics)
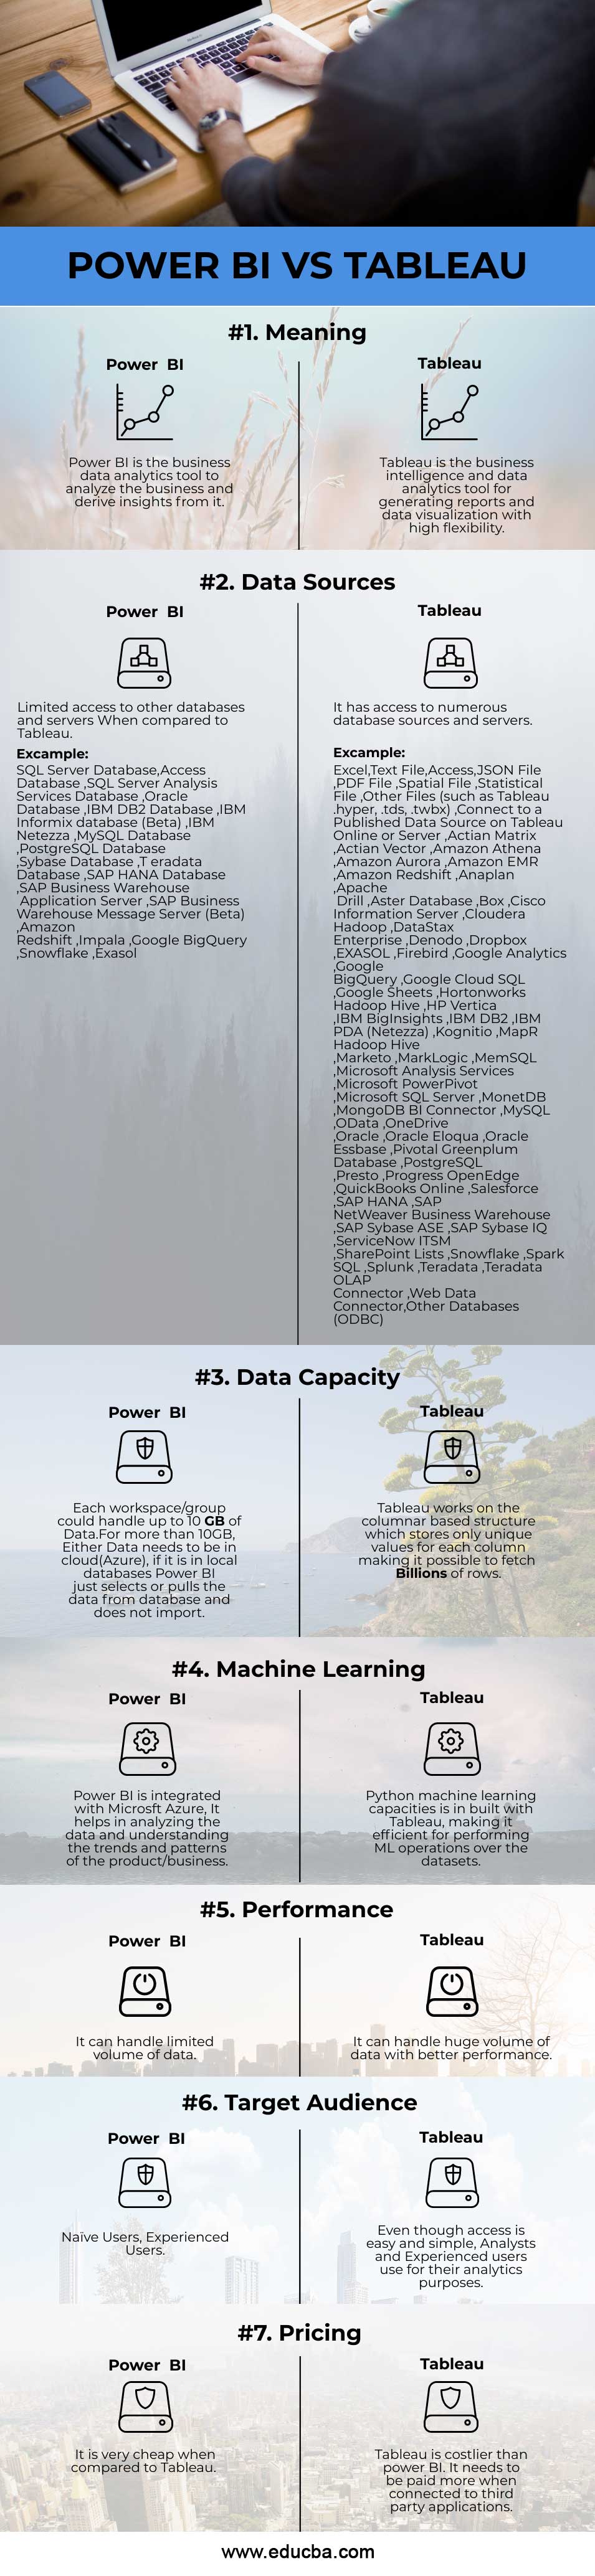
Below are the top 7 comparisons between Power BI vs Tableau:
Key Differences Between Power BI and Tableau
Below are the lists of points that describe the difference between Power BI and Tableau:
Power BI vs Tableau differs majorly in the visualization standpoint ability to extract the data from different servers.
Below are the essential key Differences Between Power BI vs Tableau:
1. Data Access
Power BI cannot connect to Hadoop databases but enables data extraction from Azure, Salesforce, and googles analytics. Tableau allows accessing data in the cloud and connecting to Hadoop databases. It also identifies the resource automatically.
2. Visualizations
Power Bi provides numerous data points to provide visualization. It has around 3500 data points for drilling down across the dataset and conducting an analysis. Without any coding language, users can create charts and scatter plots in Tableau using the drag-and-drop method, and it also does not restrict the number of data points.
3. Customer Support
Power BI provides limited customer support. Tableau has strong customer support and community forums for discussions. It has categorized the help into online, desktop, and server support.
4. Set-Up
Power BI is available in three categories. Desktop, mobile, and service. The fundamental set-up is Azure Tenant. Tableau allows sharing of the results generated on the Tableau desktop over Tableau Online or Tableau Server.
5. Deployment
Power BI is the Saas model, ie. Software as a Service. Tableau is available both on-premises and cloud. When huge amounts of data are available in the cloud, it produces the best result.
Power BI and Tableau Comparison Table
Below is the Comparison table between Power BI and Tableau:
| Power BI | Tableau |
| Power BI is a business data analytics tool to analyze and derive insights from the business. | Tableau is a business intelligence and data analytics tool for generating reports and data visualization with high flexibility. |
| Data Sources
Limited access to other databases and servers Examples: SQL Server Database, Access Database, SQL Server Analysis Services Database, Oracle Database, IBM DB2 Database, IBM Informix database (Beta), IBM Netezza, MySQL Database, PostgreSQL Database, Sybase Database, Teradata Database, SAP HANA Database, SAP Business Warehouse Application Server, SAP Business Warehouse Message Server (Beta), Amazon Redshift, Impala, Google BigQuery, Snowflake, Exasol. |
It has access to numerous database sources and servers.
Examples: Excel, Text File, Access, JSON File, PDF File, Spatial File, Statistical File, Other Files (such as Tableau .hyper, .tds, .twbx), Connect to a Published Data Source on Tableau Online or Server, Actian Matrix, Actian Vector, Amazon Athena, Amazon Aurora, Amazon EMR, Amazon Redshift, Anaplan, Apache Drill ,Aster Database, Box ,Cisco Information Server, Cloudera Hadoop, DataStax Enterprise, Denodo, Dropbox, EXASOL, Firebird, Google Analytics, Google BigQuery, Google Cloud SQL, Google Sheets, Hortonworks Hadoop Hive, HP Vertica, IBM BigInsights, IBM DB2, IBM PDA (Netezza), Kognitio, MapR Hadoop Hive, Marketo, MarkLogic, MemSQL, Microsoft Analysis Services, Microsoft PowerPivot, Microsoft SQL Server, MonetDB, MongoDB BI Connector, MySQL, OData, OneDrive, Oracle, Oracle Eloqua, Oracle Essbase, Pivotal Greenplum Database, PostgreSQL, Presto, Progress OpenEdge,QuickBooks Online, Salesforce, SAP HANA, SAP NetWeaver Business Warehouse, SAP Sybase ASE, SAP Sybase IQ, ServiceNow ITSM, SharePoint Lists, Snowflake, Spark SQL, Splunk, Teradata, Teradata OLAP Connector, Web Data Connector, Other Databases (ODBC). |
| Data Capacity
Each workspace/group could handle up to 10 GB of Data. For more than 10GB, Either Data needs to be in a cloud(Azure); if it is in local databases, Power BI selects or pulls the data from a database and does not import. |
Tableau works on the columnar-based structure, which stores unique values for each column, making it possible to fetch Billions of rows. |
| Machine Learning
Power BI is integrated with Microsoft Azure; It helps analyze the data and understand the trends and patterns of the product/business. |
Python machine learning capacities are inbuilt with Tableau, making it efficient for performing ML operations over the datasets. |
| Performance
It can handle a limited volume of data. |
It can handle a huge volume of data with better performance. |
| Target Audience
Naïve Users, Experienced Users. |
Even though access is easy, Analysts and Experienced users use it for their analytics purposes. |
| Pricing
It is very cheap when compared to Tableau. |
Tableau is costlier than Power BI. It needs to be paid more when connected to third-party applications. |
Conclusion
Business Intelligent tools play a vital role in making business decisions. As far as Power BI vs Tableau is concerned, both Power BI and Tableau have their features, pros, and cons. It all depends upon the business’s needs and requirements. If the business requirement is to analyze, the limited amount of data and functionality Power BI is the best way to opt for as it is cheaper than Tableau. But Tableau provides a lot of functionality and drilling down options when it comes to handling huge data from various sources and needs to perform any statistics and fantastic data visualization over the data. At the same time, the investment cost is high. So it highly depends on the business scale and requirements. Both Power BI vs Tableau tools perform outstandingly, so we could not conclude that only one tool outperforms the other as features like Data Preparation, Data Storage, Data validation, and ETL operations are performed by both tools inefficient and without any latency.
Recommended Articles
This has been a guide to Power BI vs Tableau. Here we have discussed Power BI vs Tableau head-to-head comparison, key differences, infographics, and comparison table. You may also look at the following articles to learn more –
