EDUCBA

EDUCBA

MENUMENU
  • Free Tutorials
  • Free Courses
  • Certification Courses
  • 360+ Courses All in One Bundle
  • Login
Home Data Science Data Science Tutorials Head to Head Differences Tutorial Looker vs Tableau
Secondary Sidebar
Head to Head Differences Tutorial
  • Differences Tutorial
    • Scikit Learn vs TensorFlow
    • Azure Functions vs Logic Apps
    • Azure Data Factory vs Databricks
    • SHA1 vs MD5
    • Azure SQL Database vs Managed Instance
    • Azure SQL Database vs SQL Server
    • PostgreSQL vs MySQL
    • PostgreSQL vs MySQL Benchmark
    • ArangoDB vs MongoDB
    • Cloud Computing vs Big Data Analytics
    • T-SQL vs SQL
    • PostgreSQL vs MariaDB
    • Spark vs Impala
    • Datadog vs Splunk
    • Domo vs Tableau
    • Data Scientist vs Data Engineer vs Statistician
    • Big Data Vs Machine Learning
    • Predictive Analytics vs Business Intelligence
    • AI vs Machine Learning vs Deep Learning
    • Business Intelligence vs Data Warehouse
    • Apache Kafka vs Flume
    • Data Science vs Machine Learning
    • Business Analytics Vs Predictive Analytics
    • Data mining vs Web mining
    • Data Science Vs Data Mining
    • Data Science Vs Business Analytics
    • Analyst vs Associate
    • Apache Hive vs Apache Spark SQL
    • Apache Nifi vs Apache Spark
    • Apache Spark vs Apache Flink
    • Apache Storm vs Kafka
    • Artificial Intelligence vs Business Intelligence
    • Artificial Intelligence vs Human Intelligence
    • Al vs ML vs Deep Learning
    • SQL vs SQLite
    • Assembly Language vs Machine Language
    • AWS vs AZURE
    • AWS vs Azure vs Google Cloud
    • Big Data vs Data Mining
    • Big Data vs Data Science
    • Big Data vs Data Warehouse
    • Blu-Ray vs DVD
    • Business Intelligence vs Big Data
    • Business Intelligence vs Business Analytics
    • Business Intelligence vs Data analytics
    • Business Intelligence VS Data Mining
    • Business Intelligence vs Machine Learning
    • Business Process Re-Engineering vs CI
    • Cassandra vs Elasticsearch
    • Cassandra vs Redis
    • Cloud Computing Public vs Private
    • Cloud Computing vs Fog Computing
    • Cloud Computing vs Grid Computing
    • Cloud Computing vs Hadoop
    • Computer Network vs Data Communication
    • Computer Science vs Data Science
    • Computer Scientist vs Data Scientist
    • Customer Analytics vs Web Analytics
    • Data Analyst vs Data Scientist
    • Data Analytics vs Business Analytics
    • Data Analytics vs Data Analysis
    • Data Analytics Vs Predictive Analytics
    • Data Lake vs Data Warehouse
    • Data Mining Vs Data Visualization
    • Data mining vs Machine learning
    • Data Mining Vs Statistics
    • Data Mining vs Text Mining
    • Data Science vs Artificial Intelligence
    • Data science vs Business intelligence
    • Data Science Vs Data Engineering
    • Data Science vs Data Visualization
    • Data Science vs Software Engineering
    • Data Scientist vs Big Data
    • Data Scientist vs Business Analyst
    • Data Scientist vs Data Engineer
    • Data Scientist vs Data Mining
    • Data Scientist vs Machine Learning
    • Data Scientist vs Software Engineer
    • Data visualisation vs Data analytics
    • Data vs Information
    • Data Warehouse vs Data Mart
    • Data Warehouse vs Database
    • Data Warehouse vs Hadoop
    • Data Warehousing VS Data Mining
    • DBMS vs RDBMS
    • Deep Learning vs Machine learning
    • Digital Analytics vs Digital Marketing
    • Digital Ocean vs AWS
    • DOS vs Windows
    • ETL vs ELT
    • Small Data Vs Big Data
    • Apache Hadoop vs Apache Storm
    • Hadoop vs HBase
    • Between Data Science vs Web Development
    • Hadoop vs MapReduce
    • Hadoop Vs SQL
    • Google Analytics vs Mixpanel
    • Google Analytics Vs Piwik
    • Google Cloud vs AWS
    • Hadoop vs Apache Spark
    • Hadoop vs Cassandra
    • Hadoop vs Elasticsearch
    • Hadoop vs Hive
    • Hadoop vs MongoDB
    • HADOOP vs RDBMS
    • Hadoop vs Spark
    • Hadoop vs Splunk
    • Hadoop vs SQL Performance
    • Hadoop vs Teradata
    • HBase vs HDFS
    • Hive VS HUE
    • Hive vs Impala
    • JDBC vs ODBC
    • Kafka vs Kinesis
    • Kafka vs Spark
    • Cloud Computing vs Data Analytics
    • Data Mining Vs Data Analysis
    • Data Science vs Statistics
    • Big Data Vs Predictive Analytics
    • MapReduce vs Yarn
    • Hadoop vs Redshift
    • Looker vs Tableau
    • Machine Learning vs Artificial Intelligence
    • Machine Learning vs Neural Network
    • Machine Learning vs Predictive Analytics
    • Machine Learning vs Predictive Modelling
    • Machine Learning vs Statistics
    • MariaDB vs MySQL
    • Mathematica vs Matlab
    • Matlab vs Octave
    • MATLAB vs R
    • MongoDB vs Cassandra
    • MongoDB vs DynamoDB
    • MongoDB vs HBase
    • MongoDB vs Oracle
    • MongoDB vs Postgres
    • MongoDB vs PostgreSQL
    • MongoDB vs SQL
    • MongoDB vs SQL server
    • MS SQL vs MYSQL
    • MySQL vs MongoDB
    • MySQL vs MySQLi
    • MySQL vs NoSQL
    • MySQL vs SQL Server
    • MySQL vs SQLite
    • Neural Networks vs Deep Learning
    • PIG vs MapReduce
    • Pig vs Spark
    • PL SQL vs SQL
    • Power BI Dashboard vs Report
    • Power BI vs Excel
    • Power BI vs QlikView
    • Power BI vs SSRS
    • Power BI vs Tableau
    • Power BI vs Tableau vs Qlik
    • PowerShell vs Bash
    • PowerShell vs CMD
    • PowerShell vs Command Prompt
    • PowerShell vs Python
    • Predictive Analysis vs Forecasting
    • Predictive Analytics vs Data Mining
    • Predictive Analytics vs Data Science
    • Predictive Analytics vs Descriptive Analytics
    • Predictive Analytics vs Statistics
    • Predictive Modeling vs Predictive Analytics
    • Private Cloud vs Public Cloud
    • Regression vs ANOVA
    • Regression vs Classification
    • ROLAP vs MOLAP
    • ROLAP vs MOLAP vs HOLAP
    • Spark SQL vs Presto
    • Splunk vs Elastic Search
    • Splunk vs Nagios
    • Splunk vs Spark
    • Splunk vs Tableau
    • Spring Cloud vs Spring Boot
    • Spring vs Hibernate
    • Spring vs Spring Boot
    • Spring vs Struts
    • SQL Server vs PostgreSQL
    • Sqoop vs Flume
    • Statistics vs Machine learning
    • Supervised Learning vs Deep Learning
    • Supervised Learning vs Reinforcement Learning
    • Supervised Learning vs Unsupervised Learning
    • Tableau vs Domo
    • Tableau vs Microstrategy
    • Tableau vs Power BI vs QlikView
    • Tableau vs QlikView
    • Tableau vs Spotfire
    • Talend Vs Informatica PowerCenter
    • Talend vs Mulesoft
    • Talend vs Pentaho
    • Talend vs SSIS
    • TensorFlow vs Caffe
    • Tensorflow vs Pytorch
    • TensorFlow vs Spark
    • TeraData vs Oracle
    • Text Mining vs Natural Language Processing
    • Text Mining vs Text Analytics
    • Cloud Computing vs Virtualization
    • Unit Test vs Integration Test?
    • Universal analytics vs Google Analytics
    • Visual Analytics vs Tableau
    • R vs Python
    • R vs SPSS
    • Star Schema vs Snowflake Schema
    • DDL vs DML
    • R vs R Squared
    • ActiveMQ vs Kafka
    • TDM vs FDM
    • Linear Regression vs Logistic Regression
    • Slf4j vs Log4j
    • Redis vs Kafka
    • Travis vs Jenkins
    • Fact Table vs Dimension Table
    • OLTP vs OLAP
    • Openstack vs Virtualization
    • Cluster v/s Factor analysis
    • Informatica vs Datastage
    • CCBA vs CBAP
    • SPSS vs EXCEL
    • Excel vs Tableau
    • Cassandra vs MySQL
    • RabbitMQ vs Kafka
    • SAAS vs Cloud
    • RabbitMQ vs Redis
    • AMQP vs MQTT
    • Forward Chaining vs Backward Chaining
    • Google Data Studio vs Tableau
    • ActiveMQ vs RabbitMQ
    • Cloud vs Data Center
    • Cores vs Threads
    • Inner Join vs Outer Join
    • ZeroMQ vs Kafka
    • Mxnet vs TensorFlow
    • Redis vs Memcached
    • RDBMS vs NoSQL
    • AWS Direct Connect vs VPN
    • Cassandra vs Couchbase
    • Elegoo vs Arduino
    • Redis vs MongoDB
    • Chef vs Puppet
    • GSM vs GPRS
    • Keras vs TensorFlow vs PyTorch
    • Cloudflare vs CloudFront
    • Bitmap vs Vector
    • Left Join vs Right Join
    • IaaS vs PaaS
    • Blue Prism vs UiPath
    • GNSS vs GPS
    • Cloudflare vs Akamai
    • GCP vs AWS vs Azure
    • Arduino Mega vs Uno
    • Qualitative vs Quantitative Data
    • Arduino Micro vs Nano
    • PIC vs Arduino
    • PRTG vs Solarwinds
    • PostgreSQL vs SQLite
    • Metabase vs Tableau
    • Arduino Leonardo vs Uno
    • Arduino Due vs Mega
    • ETL Vs Database Testing
    • DBMS vs File System
    • CouchDB vs MongoDB
    • Arduino Nano vs Mini
    • IaaS vs PaaS vs SaaS
    • On-premise vs off-premise
    • Couchbase vs CouchDB
    • Tableau Dimension vs Measure
    • Cognos vs Tableau
    • Data vs Metadata
    • RethinkDB vs MongoDB
    • Cloudera vs Snowflake
    • HBase vs Cassandra
    • Business Analytics vs Business Intelligence
    • R Programming vs Python
    • MongoDB vs Hadoop
    • MySQL vs Oracle
    • OData vs GraphQL
    • Soft Computing vs Hard Computing
    • Binary Tree vs Binary Search Tree
    • Datadog vs CloudWatch
    • B tree vs Binary tree
    • Cloudera vs Hortonworks
    • DevSecOps vs DevOps
    • PostgreSQL Varchar vs Text
    • PostgreSQL Database vs schema
    • MapReduce vs spark
    • Hypervisor vs Docker
    • SciLab vs Octave
    • DocumentDB vs DynamoDB
    • PostgreSQL union vs union all
    • OrientDB vs Neo4j
    • Data visualization vs Business Intelligence
    • QlikView vs Qlik Sense
    • Neo4j vs MongoDB
    • Postgres Schema vs Database
    • Mxnet vs Pytorch
    • Naive Bayes vs Logistic Regression
    • Random Forest vs Decision Tree
    • Random Forest vs XGBoost
    • DynamoDB vs Cassandra
    • Looker vs Power BI
    • PostgreSQL vs RedShift
    • Presto vs Hive
    • Random forest vs Gradient boosting
    • Gradient boosting vs AdaBoost
    • Amazon rds vs Redshift
    • Bigquery vs Bigtable
    • Data Architect vs Data Engineer
    • DataSet vs DataTable
    • dataset vs dataframe
    • Dataset vs Database
    • New Relic vs Splunk
    • Data Architect and Management Designer
    • Data Engineer vs Data Analyst
    • Grafana vs Tableau
    • MySQL text vs Varchar
    • Relational Database vs Flat File
    • Datadog vs Prometheus
    • Neo4j vs Neptune
    • Data Mining vs Data warehousing
    • DocumentDB vs MongoDB
    • PostScript vs PCL
    • QRadar vs Splunk
    • Qlik Sense vs Tableau
    • DigitalOcean vs Google Cloud
    • PostgreSQL vs Elasticsearch
    • Redshift vs blueshift
    • Gitlab vs Azure DevOps

Related Courses

Online Data Science Course

Online Tableau Training

Azure Training Course

Hadoop Certification Course

Data Visualization Courses

All in One Data Science Course

Looker vs Tableau

By Priya PedamkarPriya Pedamkar

Looker vs Tableau 

Differences Between Looker vs Tableau

Looker is a data-discovery platform that helps companies make better business decisions through real-time access to data. No matter the size, data can be analyzed within Looker’s 100% in-database and browser-based platform. Looker analytics integrates with any SQL database or data warehouses, such as Amazon Athena, Green plum and Microsoft Azure SQL Data Warehouse. Tableau offers robust BI tools that enhance data visualization and discovery for all types of organizations and business users. With simple drag-and-drop features, users easily analyze key data, share critical insights across the enterprise, and create innovative visualizations and reports. In addition, Tableau offers the option to embed dashboards into existing business applications such as Jive, SharePoint, and Salesforce.

Business Intelligence

Business Intelligence leverages software and service to transform data into actionable intelligence that helps an organization to make out strategic and tactical business solutions. BI involves the process of collaborating tools, applications and methodologies for collecting the data involved analyzing it and execute queries which result in reports and data visualization structures.

Importance of Business Intelligence

  • Accelerating and improving decision-making
  • Improve sales and negotiations
  • Identify new opportunities
  • Develop efficiency
  • Optimizing internal business processes
  • Increasing operational efficiency
  • Driving new revenues
  • Gaining a competitive advantage over business rivals.
  • Make fact-based decisions

Data Visualisation

A picture speaks a thousand data points. And representing these informative data points in a graphical manner is called Data visualization. These graphical representations portray the significance and implications of the data in a clear and effective manner.

Start Your Free Data Science Course

Hadoop, Data Science, Statistics & others

Importance of Data Visualisation:

  • Depicts data to be more accessible and less confusing.
  • Outliers can be speckled with less effort.
  • Even large Information can be consumed by the audience with ease.
  • Unknown correlations and relationships within data can be discovered
  • Kick the need for data scientists.

Head to Head Comparison Between Looker and Tableau (Infographics)

Below are the top 11 comparison Looker and Tableau:

Tableau vs Looker Infographics

Key Comparison Performance Between Looker and Tableau

Below are the lists of points, describe the key Differences Between Looker andTableau:

  • Data collection, storage, and access

Both the Looker and Tableau tools do not offer data collection and storage but we can connect to the data sources like SQL from either of the tools and access data. In-ground tableau provides support for a large number of data sources compared to looker.

  • Data Modeling

Data modeling is the process of taking raw data as input cleaned, combined, converted and made ready for data analysis. data modeling can be carried out in ad hoc or publish all these data models in a platform.

All in One Data Science Bundle(360+ Courses, 50+ projects)
Python TutorialMachine LearningAWSArtificial Intelligence
TableauR ProgrammingPowerBIDeep Learning
Price
View Courses
360+ Online Courses | 50+ projects | 1500+ Hours | Verifiable Certificates | Lifetime Access
4.7 (86,650 ratings)

When it comes to data modeling Looker’s LookML data modeling layer is its core strength with a wider margin.

  • Data Visualisation

Looker provides data visualization features, channeling numbers into charts and graphs. These are displayed in various real-time dashboards that users can check at a glance. And Looker’s integration with products from companies like Google and Amazon Web Services makes it even more powerful. Numerous vendor tools and applications parse and store data in particular ways, but Looker is seen as a leader in the process of taking in raw data and refining it.

Tableau can visualize all types of data, from revenue growth to weather patterns. Its customizable visualization software allows users to create dynamic visualizations that help tell the data story.

  • Self Service BI

Looker offers all of your business users self-service capabilities. Whenever a user needs to see it and analyze it,  he can see and analyze it. Additionally, you can provide external self-service access to your dashboards and other data, visualized or not.

The self-service business intelligence component that Tableau brings to the table is also pretty powerful. All of your users, no matter what their background, can act as a data scientist. A drag-and-drop interface makes analyzing your data simple when using the Tableau system. And the self-service capabilities don’t provide surface analysis. The analytics allow your users to get down into the nitty-gritty details of their data if they so choose, so they can find the insights that they’re trying to find.

  • Deployment

Deployment isn’t the biggest determinant of a BI vendor’s value, but it does matter for businesses thinking of adopting one. Tableau offers several different products, of which there are various deployments. Tableau Desktop and Tableau Server are both on-premise, using your business’ servers. Tableau Online, as the name suggests, is a web-based platform operating in the cloud. Looker, on the other hand, has an exclusively cloud-based deployment.

Looker and Tableau Comparisons by Business

Below is the comparison table between Looker and Tableau.
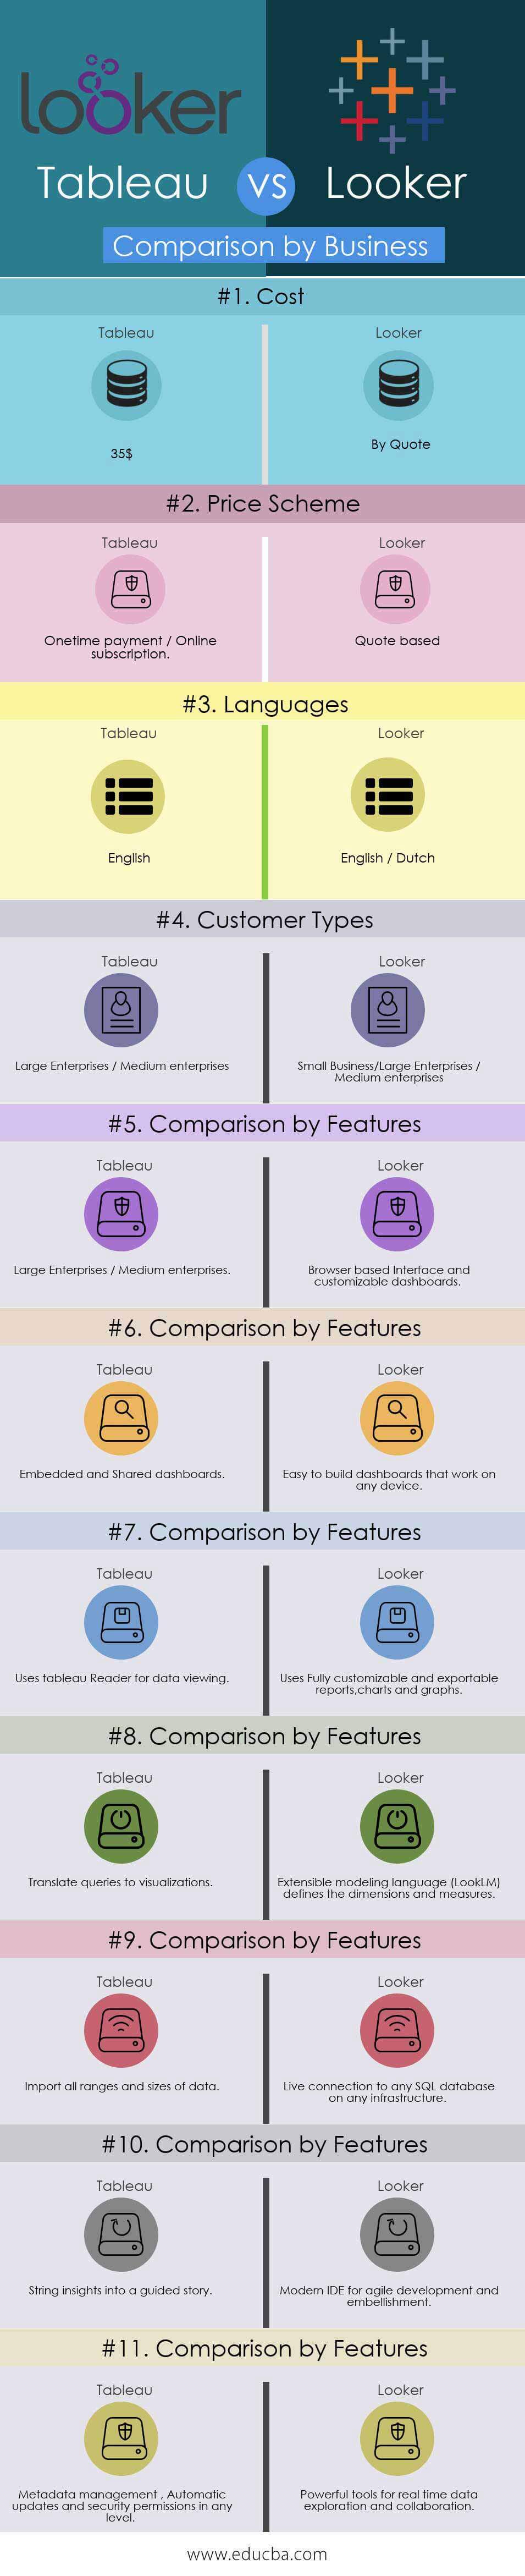
Comparison

by Business

Tableau Looker
Cost 35$ By Quote
Price Scheme Onetime payment / Online subscription Quote based
Languages English English / Dutch
Customer Types Large Enterprises / Medium enterprises Small Business/Large Enterprises / Medium Enterprises

Looker vs Tableau Comparison by Features

Below is the Comparison Between Looker vs Tableau

Tableau Looker
Toggle view and drag and drop Browser-based Interface and customizable dashboards
Embedded and Shared dashboards Easy to build dashboards that work on any device
Uses Tableau Reader for data viewing Uses Fully customizable and exportable reports, charts and graphs
Translate queries to visualizations Extensible modeling language (LookLM) defines the dimensions and measures
Import all ranges and sizes of data Live connection to any SQL database on any infrastructure
String insights into a guided story Modern IDE for agile development and embellishment
Metadata management, Automatic updates and security permissions in any level Powerful tools for real-time data exploration and collaboration

Conclusion

In summary, the platform you select is going to be highly dependent on your future vision, your data strategy, and your business users’ needs. Before any tool selections, defining that future state with a data strategy is very important. In consideration, Looker is different and but provides a full semantic model for governance and a single source of the truth, as well as power sharing and exploration capabilities. Tableau blows the competition out of the water when it comes to visualization and ease of use. At the end of the day, however, Tableau is only a visualization tool — not an analytics platform.

So if your business prefers or is required to use on-premise software, you’ll need to go with Tableau. Otherwise, you can take a look at both Looker and Tableau solutions.

Recommended Articles

This has been a guide to Looker vs Tableau. Here we have discussed head to head comparison, key differences, along with infographics and comparison table. You may also look at the following articles to learn more –

  1. Power BI vs QlikView-What are the benefits 
  2. Find Out The Differences-Azure Paas vs Iaas
  3. Tableau vs Microstrategy – 5 Useful Comparisons to learn
  4. Talend vs Mulesoft – 8 Useful thing you need to know
  5. 7 Important difference between Power BI vs Tableau
  6. Find out the 6 Useful comparisons between Tableau vs QlikView
  7. Power BI vs Tableau vs Qlik|:| What are the comparisons
  8. Difference between Tableau vs Power BI vs QlikView
Popular Course in this category
Data Visualization Training (15 Courses, 5+ Projects)
  15 Online Courses |  5 Hands-on Projects |  105+ Hours |  Verifiable Certificate of Completion
4.5
Price

View Course

Related Courses

Data Scientist Training (85 Courses, 67+ Projects)4.9
Tableau Training (8 Courses, 8+ Projects)4.8
Azure Training (6 Courses, 5 Projects, 4 Quizzes)4.7
Hadoop Training Program (20 Courses, 14+ Projects, 4 Quizzes)4.7
All in One Data Science Bundle (360+ Courses, 50+ projects)4.7
3 Shares
Share
Tweet
Share
Primary Sidebar
Footer
About Us
  • Blog
  • Who is EDUCBA?
  • Sign Up
  • Live Classes
  • Corporate Training
  • Certificate from Top Institutions
  • Contact Us
  • Verifiable Certificate
  • Reviews
  • Terms and Conditions
  • Privacy Policy
  •  
Apps
  • iPhone & iPad
  • Android
Resources
  • Free Courses
  • Database Management
  • Machine Learning
  • All Tutorials
Certification Courses
  • All Courses
  • Data Science Course - All in One Bundle
  • Machine Learning Course
  • Hadoop Certification Training
  • Cloud Computing Training Course
  • R Programming Course
  • AWS Training Course
  • SAS Training Course

ISO 10004:2018 & ISO 9001:2015 Certified

© 2022 - EDUCBA. ALL RIGHTS RESERVED. THE CERTIFICATION NAMES ARE THE TRADEMARKS OF THEIR RESPECTIVE OWNERS.

EDUCBA
Free Data Science Course

SPSS, Data visualization with Python, Matplotlib Library, Seaborn Package

*Please provide your correct email id. Login details for this Free course will be emailed to you

By signing up, you agree to our Terms of Use and Privacy Policy.

EDUCBA Login

Forgot Password?

By signing up, you agree to our Terms of Use and Privacy Policy.

EDUCBA
Free Data Science Course

Hadoop, Data Science, Statistics & others

*Please provide your correct email id. Login details for this Free course will be emailed to you

By signing up, you agree to our Terms of Use and Privacy Policy.

EDUCBA

*Please provide your correct email id. Login details for this Free course will be emailed to you

By signing up, you agree to our Terms of Use and Privacy Policy.

Let’s Get Started

By signing up, you agree to our Terms of Use and Privacy Policy.

This website or its third-party tools use cookies, which are necessary to its functioning and required to achieve the purposes illustrated in the cookie policy. By closing this banner, scrolling this page, clicking a link or continuing to browse otherwise, you agree to our Privacy Policy

Loading . . .
Quiz
Question:

Answer:

Quiz Result
Total QuestionsCorrect AnswersWrong AnswersPercentage

Explore 1000+ varieties of Mock tests View more