Updated June 9, 2023
Introduction to Normal Distribution Formula in Excel
Normdist function in Excel is under the statistical category, which calculates the Normal Distribution of any data based on Mean and Standard Deviation. Normal Distribution shows how the data points should distribute and the means and offers the standard deviation on both sides of the mean. To find the normal distribution of any number, we must first have a mean and standard deviation, mainly in the syntax.
Normal Distribution Summary
Normal distribution or Gaussian Distribution is a statistical distribution that is widely used in the analytical industry and has a generally graphical representation as a bell-shaped curve which has exactly half of the observations at the right-hand side of Mean/Median/Mode and exactly half of them on the left-hand side of Mean/Median/Mode. This means normal distribution is a symmetric distribution around its mean.
The formula used to calculate the probabilities of the normal distribution is as follows:
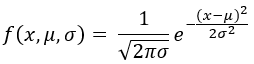
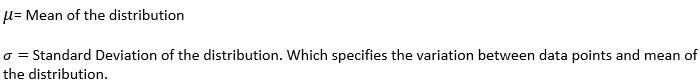
Where,
Please note that the variable x takes values from -∞ to +∞
Syntax
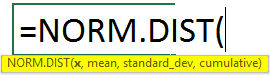
Arguments in the Normal Distribution Formula in Excel
x – Required argument that specify the value for which we want to find the value for normal density or normal cumulative distribution.
Mean – Required argument that specifies the mean of the normal distribution.
Standard_dev – A required argument that is nothing but the standard deviation (square root of variance) of normal distribution.
Cumulative – This is a logical value that specifies the type of normal distribution to be calculated. If set to TRUE, it gives value for the Cumulative Normal Distribution Formula. If set FALSE, it gives value for Normal Probability Density Formula.
In Excel, you can also find NORMDIST, which has the same functionality. However, if you will read the instructions properly, it is there just to use an Excel file with version 2007 or earlier. After 2010 onwards, versions of Excel, NORMDIST, are replaced by NORM.DIST. Maybe in the latest release of Microsoft Excel (Excel 2019), you may not see this version of the formula. We are going to use NORM.DIST to find pdf and CDF for normal distribution.
Let’s get things caught up with some examples:
How to Use Normal Distribution Formula in Excel?
Normal Formula Distribution in Excel is very easy and simple. Let’s comprehend with examples and how to use the Normal Distribution Formula in Excel.
Example #1 – Finding Cumulative Normal Distribution Probability
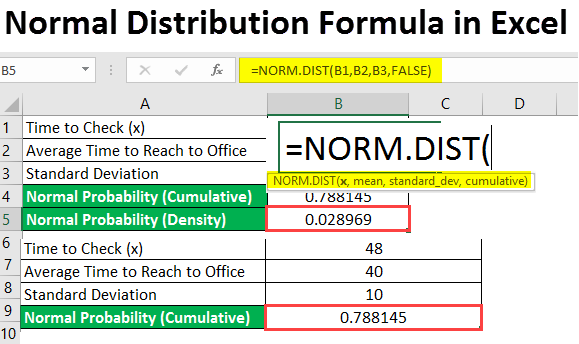
Suppose you are a working professional, and it takes an average of 40 minutes to reach the office. With the standard deviation of 10 minutes (10 minutes late or 10 minutes early) and the assumption that the time it takes you to reach the office is normally distributed with the mean mentioned above, what are the chances/probability that you reach to office in less than 48 minutes?
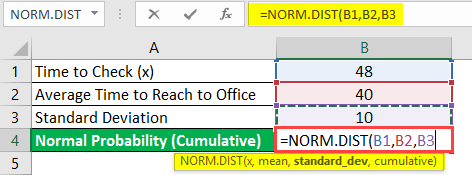
See the screenshot below for better visualization of this problem:
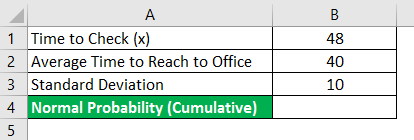
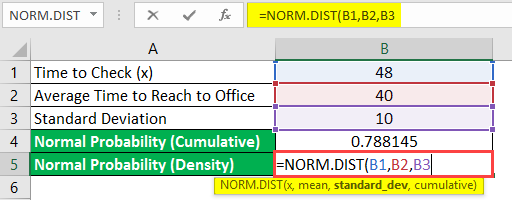
- In cell B1, there is a time we want to find the normal probabilities for.
- In cell B2, we have the average time to reach the office.
- In cell B3, you have the value for standard deviation in terms of time to reach to office.
- In cell B4, you will be calculating the normal probabilities.
Start typing the formula for normal distribution in cell B4.
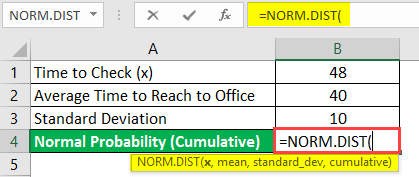
The best thing about Excel is that it gives you all the arguments associated with the function as soon as you type the keyword. As we can see here in cell B4.
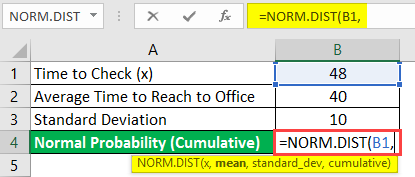
Mention the first argument, the value you want to find the normal probability for, i.e., the value of x, already set in cell B1.
The second argument will be the mean time it takes to reach to office, which is already set under cell B2.
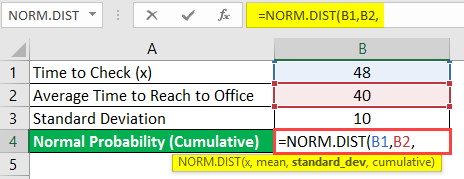
Mention the next argument, which is a standard deviation in minutes to reach the office. It’s there in cell B3.
At last, mention a logical argument as TRUE as we want to find out the chances/probability that you reach the office within 48 minutes (or before 48 minutes).
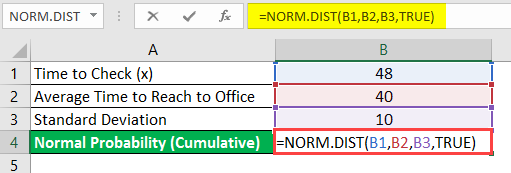
We have set all the mandatory arguments to determine the cumulative probability that you reach the office within 48 minutes.
Press Enter key and see the output for this formula.
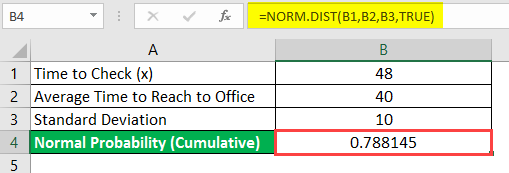
You can see almost a 79% chances that you will reach the office within 48 minutes. Consequently, there is a 21% chance that you will reach the office in more than 48 minutes.
Example #2 – Finding out the Value for Normal Probability Density Function
Suppose, in the example above, you want to find out the chances/probability that you reach the office in exactly 48 minutes, then?
We will see step by step how to achieve this result as well.
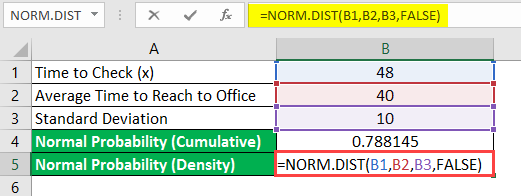
Start typing the formula for normal distribution.
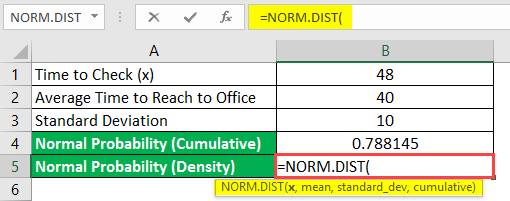
Input all the values for x, mean & standard_dev, as in the previous example. You can follow steps 2 to 4 from the previous example.
Instead of using TRUE as a value for the cumulative argument, use FALSE. It means we don’t want normal cumulative probability but are interested in normal density probability.
Press Enter key and see the output for this formula.
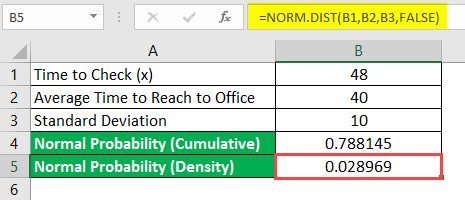
You can see that almost 3% are the chances to reach the office exactly at 48 minutes.
However, one point is to note that this probability is also not the probability of exactly reaching the office in 48 minutes. The reason for so is we have time as a continuous variable. Therefore, it’s logically impossible to reach exactly 48 minutes. There will always be some portion of time that will be there after 48 minutes. Like 48.00000000005 minutes. That’s why in statistics, they say it’s impossible to find the probability exactly at a point for a continuous random variable.
This is from this article. Let’s wrap up things with some points to remember.
Things to Remember About Normal Distribution Formula in Excel
- NORMDIST function is there to be compatible with older versions (2007 and older) of Excel. After version 2010 and above, NORM.DIST function applies as a replacement for the same, and maybe from the next version of Excel (2019 and above), we might not see the NORMDIST function.
- The normal distribution of any mean accompanies the DIST function. However, NORMDIST is with the normal distribution having mean zero and variance as unity.
- #NUM! error – this error occurs when the value for your standard deviation is less than zero.
- #VALUE! Error – This error occurs when any non-numeric argument is passed under this function.
Recommended Articles
This is a guide to the Normal Distribution Formula in Excel. Here we discuss How to use the Normal Distribution Formula in Excel, practical examples, and a downloadable Excel template. You can also go through our other suggested articles –
