Updated June 9, 2023
Lognormal Distribution in Excel
The lognormal Distribution function comes under the Statistical functions in MS Excel, one of the most important functions for financial analysis. The lognormal Distribution function calculates the probability or cumulative lognormal distribution for the given value x.
Lognormal. Dist function is the latest version of the Lognorm. Dist function, which is available in the earlier version of Excel 2007. Lognormal. Dist function arrived in Excel 2010.
The function of Lognormal Distribution:
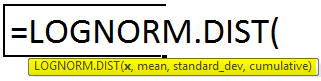
= LOGNORM.DIST(x, mean, standard_dev, cumulative)
Arguments of Syntax
- X (Mandatory Argument) – The value on which the user wishes to evaluate the Lognormal function should be greater than zero (x>0).
- Mean (Mandatory Argument) is an arithmetic mean value of ln(x).
- Standard_dev (Mandatory Argument) is the value of the standard deviation of ln(x).
- Cumulative (Optional Argument) – It will determine the form of the function; it is a logical value. By default, it will be FALSE; if a user does not provide any value, it will be considered FALSE.
1. TRUE – The lognormal function will return the cumulative distribution function when selecting TRUE.
2. FALSE– Lognormal function will return the probability distribution function on selecting FALSE.
How to Use Lognormal Distribution in Excel?
The Lognormal Distribution in Excel is very simple and easy. Let’s understand how to use the Lognormal Distribution in Excel with some examples.
Example #1
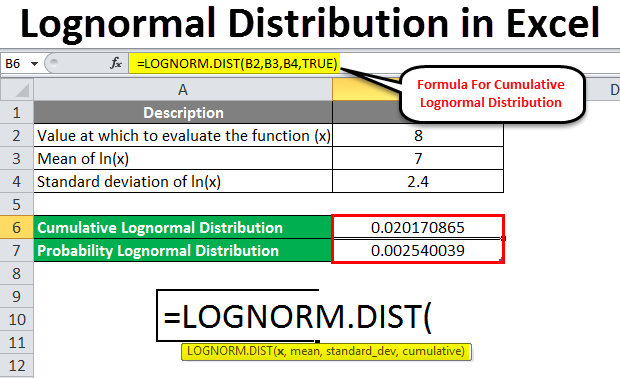
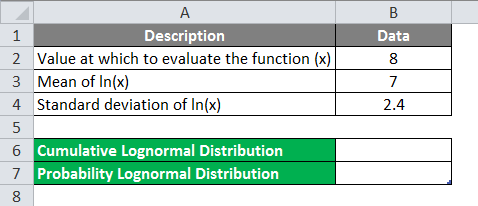
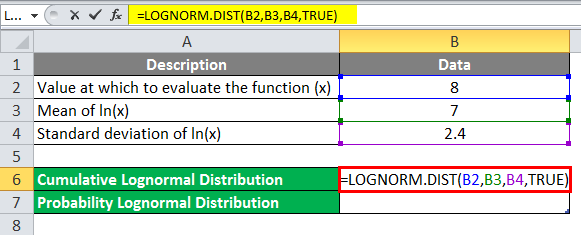
A user has a value for x=8, Mean(x)=7, and the standard deviation of ln(x)=2.4; the user wants to calculate cumulative distribution.
- Open an Excel Sheet and Calculate the Lognormal Distribution.
- Write the formula for the Lognormal Distribution function,
= LOGNORM.DIST (x, mean, standard_dev, cumulative).
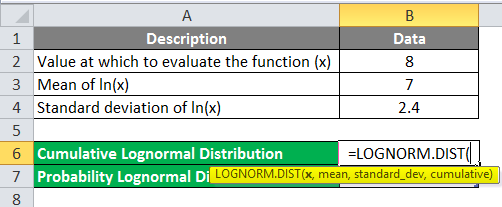
- Select the respective value from the Data table, x=8, Mean(x)=7, Standard deviation=2.4, and the Cumulative value will be TRUE as the user wants to calculate the function for the Cumulative Lognormal Distribution Function.
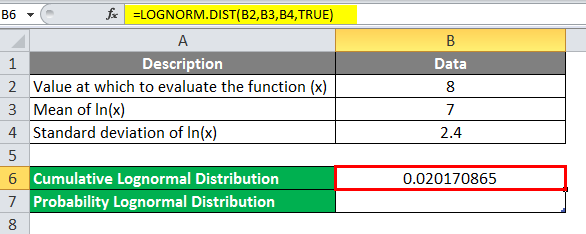
- Click on the Enter key.
Summary of Example #1
As the user has been instructed to calculate the cumulative lognormal distribution function for the x=8, Mean=7, Standard Deviation=2.4 and Cumulative = TRUE, the result is 0.020170865, which is the final Lognormal Distribution for the cumulative distribution function.
Example #2
A user has a Value for x=8, Mean (x)=7, and Standard deviation=2.4. Now we calculate Probability Distribution.
- Go to Excel, where the user wants to Calculate the Lognormal Distribution.
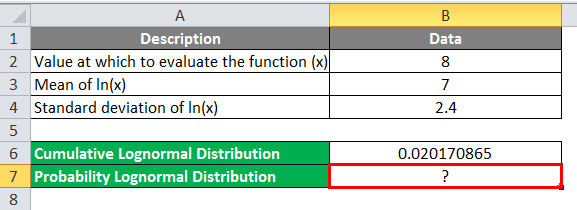
- Select the respective value from the User’s Table, x=8, Mean(x)=7, Standard deviation=2.4, and Probability Value will be FALSE. Calculate the function for the Probability Lognormal Distribution Function.
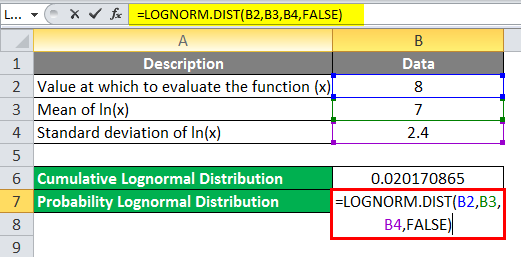
- Click on the Enter key.
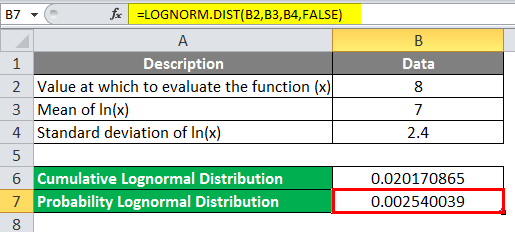
Summary of Example #2
As the user has given instruction to the Probability Lognormal Distribution function for the Value x=8, Mean (x)=7, Standard Deviation=2.4, and Cumulative = FALSE, and the result is 0.002540039, which is the final Lognormal Distribution for the Probability Distribution Function.
Example #3
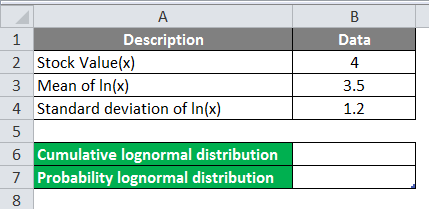
A user has Stock value for x=4, Mean(x)=3.5, and Standard Deviation of ln(x)=1.2. Now calculate Cumulative Distribution.
- Go to Excel and calculate the Lognormal Distribution.
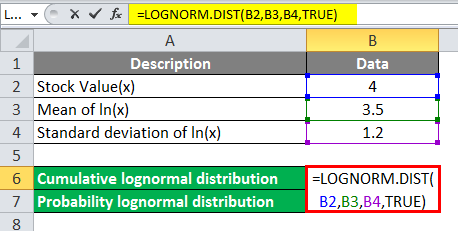
- Write a formula for the Lognormal Distribution function.
- Select the respective value from the user’s table, Stock Value(x)=4, Mean of In(x)=3.5, Standard deviation In(x)=1.2, and Cumulative value will be TRUE. Now we will calculate the function for the cumulative lognormal distribution function.
- Click on the Enter key.
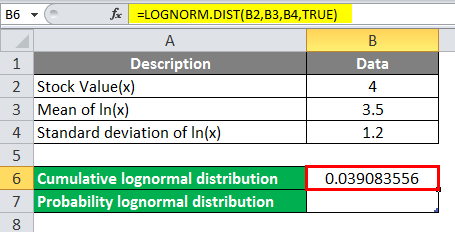
Summary of Example #3
As the user has given instruction to cumulative lognormal distribution function for the Stock Value x=4, Mean of In=3.5, Standard deviation=1.2 and Cumulative = TRUE, the result is 0.039083556, which is the final Lognormal Distribution for the cumulative distribution function.
Example #4
A user has a stock value of x=4, a mean of ln(x)=3.5, and a standard deviation of ln(x)=1.2. Now, the user wants to calculate probability distribution.
- Go to Sheet1 in Excel Sheet, where the user wants to calculate the Lognormal Distribution.
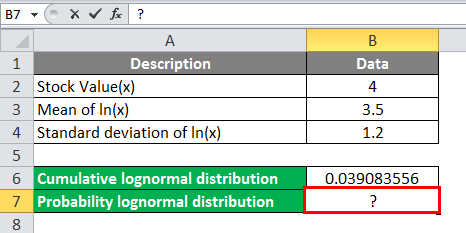
- Select the respective value from the user’s table, x=4, mean=3.5, standard_dev=1.2, and the cumulative value will be FALSE as the user wants to calculate the function for the Probability Lognormal Distribution Function.
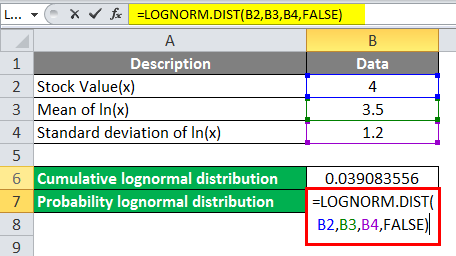
- Click on the Enter key.
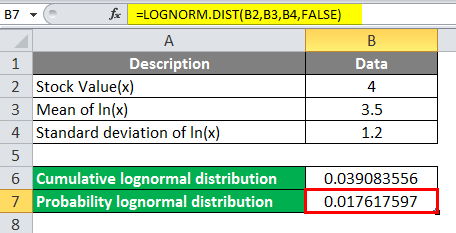
Summary of Example #4
As the user has given instruction to the Probability Lognormal Distribution function for the value x=4, mean=3.5, standard_dev=1.2, and cumulative = FALSE, the result is 0.017617597, which is the final Lognormal Distribution for the probability distribution function.
Use of Lognormal Distribution
The lognormal distribution has wide applications like financial analysis, Real state analysis, medical data analysis, and many more, as mentioned below:
- The duration of the chess game follows the lognormal distribution.
- Calculating the long-term return on Stock.
- Calculating weight and blood pressure.
- Calculating the life or size of the bacteria in disinfection, skin area, and the height of human beings.
- The length of hair, nails, teeth, etc.
- There is an n-number of uses in Economics.
Things to Remember About Lognormal Distribution in Excel
- The LOGNORM.DIST function is available in Excel 2010 and the latest version of MS Excel, so it is not available in the older version of MS Excel.
- The user can use the LOGNORMDIST Function in the older version of MS Excel (Ex. Excel 2007).
- If a user provides x values less than or equal to Zero (x<=0), the lognormal function will return #NUM! Error.
- If a user provides standard_dev values less than or equal to Zero (x<=0), then the lognormal function will return #NUM! Error.
- If a user provides an argument as non-numeric, then the result of the function will be #Value.
Recommended Articles
This has been a guide to Lognormal Distribution in Excel. Here we discussed How to use Lognormal Distribution in Excel, practical examples, and a downloadable Excel template. You can also go through our other suggested articles –
