Updated June 27, 2023
Difference Between Mean vs Median
A mean is the simple arithmetic average or the mathematical average of a set of 2 or more numerical. The mean for any given set of numerical can be computed more than a single way, including the arithmetic mean method, which uses the summation of the numerical in the series, and the other method, the geometric mean method. The median is the middlemost numerical in a sorted list of those numerical. To determine the median value in a numerical sequence, the numerical must first be arranged in value order from lowest to highest, or in other words, ascending order. If there is an odd amount of numerical, the median value is numerical, which is in the middle, with the same amount of numerical above and below.
To find the median value in a list with an even number of numerical values, you must first determine the middle pair, add them, and divide the sum by two. This process allows you to approximate the mean or average. The median is an alternative when data sets contain outliers that may skew the average or mean. The median of a sequence can be less affected by those outliers than the average or the mean.
Head To Head Comparison Between Mean vs Median (Infographics)
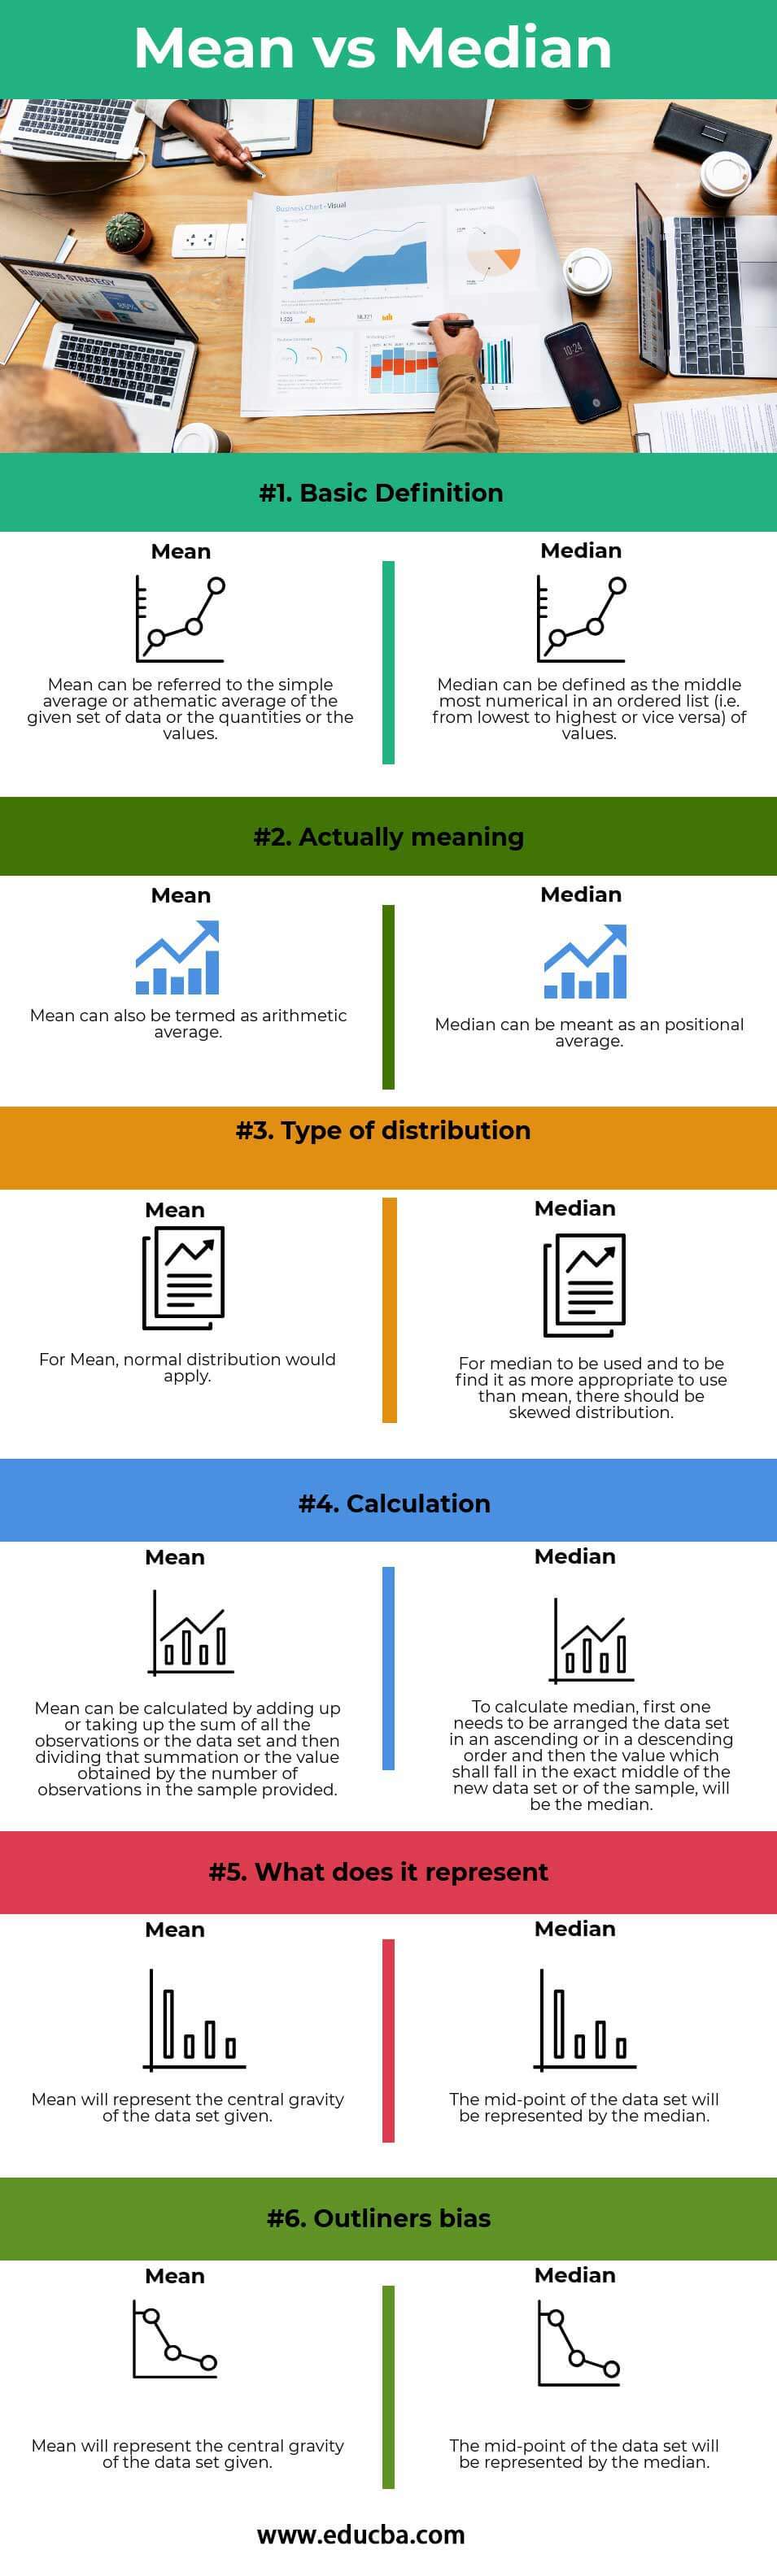
Below is the top 6 difference between Mean vs Median:
Key Differences Between Mean vs Median
Both Mean vs Median are popular choices in the market; let us discuss some of the major differences.
- In statistics, one can define the mean as the simple average or arithmetic average of a given set of data, quantities, or values. Conversely, the median is the middlemost numerical value in an ordered list (ascending or descending) of values.
- While the mean, as stated earlier, is the arithmetic average. On the other hand, the median is the positional average. The position of the data set will help determine the median value.
- Mean outlines the center of gravity of the data set or the sample, whereas the median will highlights the middle-most value of the sample or the data set.
- As mentioned earlier, the mean will be appropriate for normally distributed data. On the other hand, the median proves to be more suitable and stands as the best option when the data set, sample, or distribution exhibits skewness.
- Outliers or extreme values significantly impact the mean, unlike the median.
- To calculate the mean or average, you add all the observations in the given data set and divide the sum by the number of observations in the sample. This will give you the mean. In contrast, to find the median, you arrange the data set or sample in ascending or descending order, and the median is the value that falls exactly in the middle or center of the new data set or sample.
Mean vs Median Comparison Table
Below is the topmost comparison between Mean vs Median
| The Basis Of Comparison |
Mean |
Median |
| Basic Definition | The simple average or arithmetic average of the given data set, quantities, or values refers to it. | The middlemost numerical value in an ordered list, whether arranged from lowest to highest or vice versa, defines it. |
| Meaning | It n can also be termed an arithmetic average. | It can be meant as a positional average. |
| Type of Distribution | For Mean, a normal distribution would apply. | A skewed distribution should exist to find the median more appropriate to use than the mean. |
| Calculation | To calculate it, you add up or sum all the observations or the data set and then divide that summation of the values obtained by the number of observations in the sample provided. | To calculate it, arrange the data set in ascending or descending order and determine the value that falls exactly in the middle of the new data set or sample as the median. |
| What does it represent? | It will represent the central gravity of the data set given. | The mid-point of the data set will be represented by it. |
| Outliners Bias | The outlines largely affect it, so finding the average is inappropriate. | It is unaffected by the outliners. |
Conclusion
After discussing the above points, one can conclude that both Mean vs Median is mathematical concepts and are not one and the same but are different. The arithmetic mean can be considered one of the best measures of central tendency due to its ideal features. Still, it also has a drawback that the sampling fluctuations will influence the average.
Calculating and understanding the median is not ambiguous or challenging. One advantage of this measure is that sampling fluctuations do not affect it. However, the median is limited as it does not consider all observations in its calculation.In open-ended classification, people typically prefer the median over the mean. A central tendency implies that data points or sets cluster around their middle-most or central value. The most recognized types of these descriptive statistics are the median, mean, and mode, which people use at almost all levels of statistics and math, whether in academics, sports, investing, or studying a country’s economics.
Recommended Articles
This has been a guide to the top difference between the Mean vs Median. We also discuss the Mean vs Median key differences with infographics and comparison tables. You may also have a look at the following articles to learn more.

