Updated February 28, 2023
Introduction to Matlab sphere()
MATLAB incorporates the function sphere() which can be used to create a 3-D sphere. Since the function deals with a 3D graph, the output from the function is obtained with 3-axes co-ordinates.
Syntax:
The function sphere() in MATLAB, can be implemented in the code using any of the syntaxes described below. The syntaxes are developed based on input arguments and output arguments used to use the function.
|
Syntax |
Attribute Description |
| sphere | Creates a unit sphere i.e. a sphere with a radius of value 1. |
| [X,Y,Z]=sphere | This syntax does not plot the graph rather it returns the x,y, and z coordinates of the sphere in the form of 21X21 matrices. |
| [X,Y,Z]=sphere(n) | This syntax does not plot the graph rather it returns the x,y and z coordinates of the sphere in the form of (n+1)X(n+1) matrices.
Where n represents the number of faces, consisted of the sphere. |
| Sphere(—-) | Creates a unit sphere i.e. a sphere with being customized with the values given as input arguments in the function. |
| Sphere(ax,—-) | Creates a unit sphere i.e. a sphere with being customized with the values given as input arguments in the function with the given new co-ordinates ax. |
Examples of Matlab sphere()
Following are the examples are given below:
Example #1
sphere

axis equal
Output:
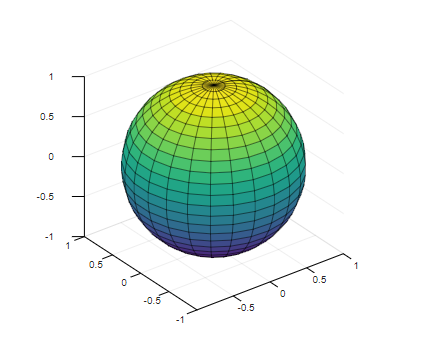
The above code results in creating a unit plot with a uniform axis setting.
The attributes that are supported by sphere()
There are two input arguments that can be used while implementing the function sphere.
| Attribute | Description |
| Number of Faces (n) | Used to decide the number of faces to use with the sphere plot |
| Target axes (ax) | Used to define new axes object |
Usage of different syntax, attributes, and resultant behavior from the function call is described in the examples defined below:
Example #2
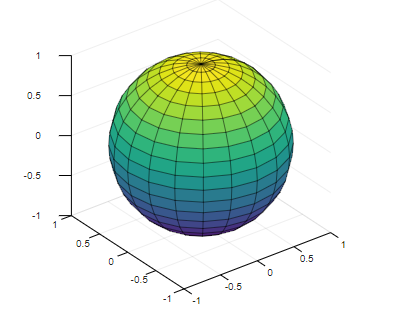
Using the syntax sphere
In the below code the 3D sphere plotting function is called using the syntax ‘sphere’.
sphere
Output:
The command generates a unit sphere i.e. a sphere with a radius of value ‘1’.
Example #3
Using the syntax [X, Y, Z] =sphere
The below code snippet generate x, y, z coordinates in order to generate the sphere plot using the functions ‘surf’ or ‘mesh’.
[P,Q,R] = sphere;

surf(P,Q,R)

axis equal
Output:
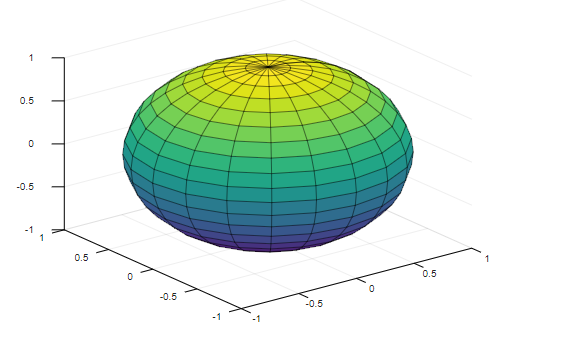
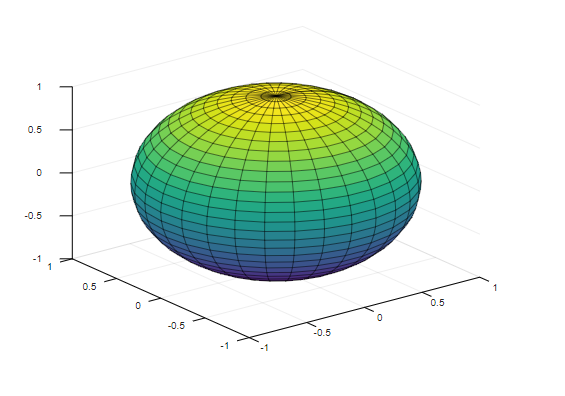
The above command has generated p, q, and r-coordinates and is given as the value for the input argument, the center of the graph, to the function surf().
Example #4
Using the syntax [X,Y, Z] =sphere(n)
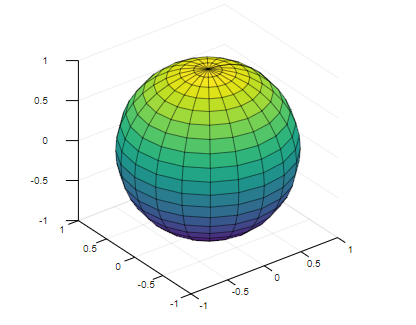
The below code snippet is defined to generate p, q, and r- coordinates using the function sphere with the value of n=25.
[P,Q,R] = sphere(25);

surf(P,Q,R)

axis equal
Output:
The value for the attribute n i.e. number of faces is set as 25 in the code. Hence it results in creating sphere with unit radius and 26-by-26 i.e. ((n+1)-by-(n+1)) faces.
Example #5
Using the syntax Sphere(—-)
The below code snippet generates a sphere with a unit radius with value for origin as an input argument (n=30) to the function sphere.
sphere(30)
Output:
The above command generates a unit sphere with 31-by-31i.e. ((n+1)-by-(n+1)) faces.
Example #6
Using the syntax Sphere(ax,—-)
The below code snippet generates a sphere with unit radius with value for origin and user-defined axes ‘px’ as an input argument to the function sphere.
tiledlayout(2,1);

px= nexttile;

sphere(px);

axis equal
Output:
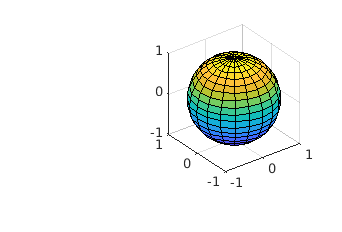
The plot from the above command consists of a unit sphere in one of the cells of the 2X1 frame with a new axis ‘px’.
Creating a Sphere with Different Measurements for Radius and Origin Apart from Unity Value:
The 3D sphere plotting function sphere can be used to generate a sphere having a radius of value more than one and shifted origin measure.
Example:
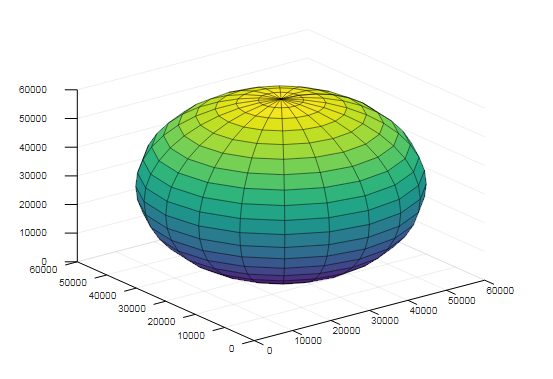
The code snippet defined below generate a plot for the sphere with a radius of 30000 and origin at (30000,30000,30000)
[p,q,r] = sphere;

p = p*30000;

q = q*30000;

r = r*30000;

figure

surf(p+30000,q+30000,r+30000)
Output:
Example:
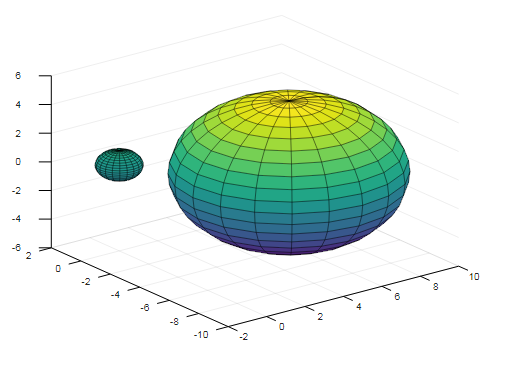
The MATLAB code defined below to generate two spheres in the same plane having two different radius and origin.
[P,Q,R] = sphere;

surf(P,Q,R)

hold on

rad = 5;

P2 = P * rad;

Q2 = Q * rad;

R2 = R * rad;

surf(P2+5,Q2-5,R2)
Output:
The resultant plot contains a unit sphere having the origin at (0,0,0) and another sphere having radius of size 5 and origin at (5, -5,0).
Creating Multiple Spheres in Different Cells of A Single Layout
MATLAB supports creating a multiple numbers of 3D sphere plots single layout, representing each graph in a different cells of it.
Example:
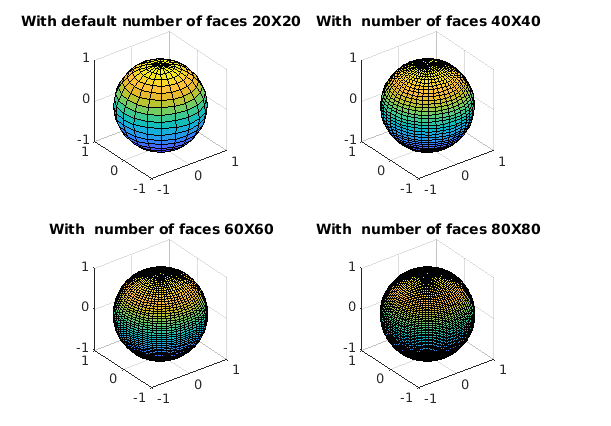
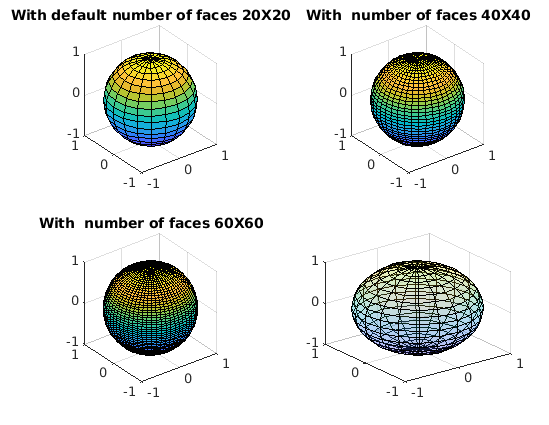
The MATLAB code generates 4 different spheres displaying them in 4 segments of a single layout.
tiledlayout(2,2);

px1 = nexttile;

sphere(px1);

axis equal

title('With default number of faces 20X20')

px2 = nexttile;

sphere(px2,40)

axis equal

title('With  number of faces 40X40')

px3 = nexttile;

sphere(px3,60)

axis equal

title('With  number of faces 60X60')

px4 = nexttile;

sphere(px4,80)

axis equal

title('With  number of faces 80X80')
Output:
Setting Radius for Multiple Spheres from An Array/matrix Input
As we have discussed earlier, the function ‘sphere’ can also be used to create multiple spheres in a single layout. The radius and origin can be set differently for each of those spheres by declaring the radius values as an array or matrix.
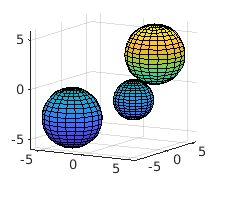
The below code snippet is designed to create 3 different spheres with 3 different radius and origin defined an array.
Example:
clc

clear

[p q r] = sphere;

nx=[3 3 3 3;-3 -3 -3 3;0 4 -2 2];

sp1=surf(p*nx(1,4)+nx(1,1),q*nx(1,4)+nx(1,2),r*nx(1,4)+nx(1,3));

hold on

sp2=surf(p*nx(2,4)+nx(2,1),q*nx(2,4)+nx(2,2),r*nx(2,4)+nx(2,3));

hold on

sp3=surf(p*nx(3,4)+nx(3,1),q*nx(3,4)+nx(3,2),r*nx(3,4)+nx(3,3));
Output:
Creating Transparent Sphere
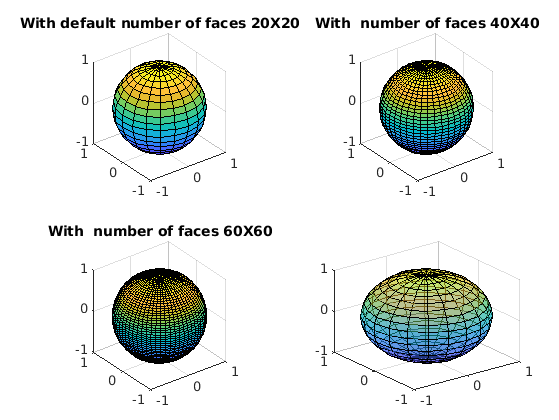
The sphere generated from the MATLAB function ‘sphere’ can be made transparent by regulating the attribute value FaceAlpha.
The below example demonstrates the impact of the variations in the value of the attribute FaceAlphaon the transparency of a unit sphere that is created by the function ‘sphere’.
Example:
Case 1: With FaceAlpha = 0.5
[x,y,z] = sphere;

obj= surf(x,y,z);

set(obj,'FaceAlpha',0.5)
Output:
Case 2: With FaceAlpha = 0.2
[x,y,z] = sphere;

obj= surf(x,y,z);

set(obj,'FaceAlpha',0.2)
Output:
Thus MATLAB programming is supported by creating 3D sphere plots using the function sphere. The function also provides flexibility to customize the display of the plots during the creation as well as editing the display after the plot is created.
Recommended Articles
This is a guide to Matlab sphere(). Here we also discuss the Introduction and syntax of matlab sphere() along with different examples and code implementation. You may also have a look at the following articles to learn more –

