Updated February 27, 2023
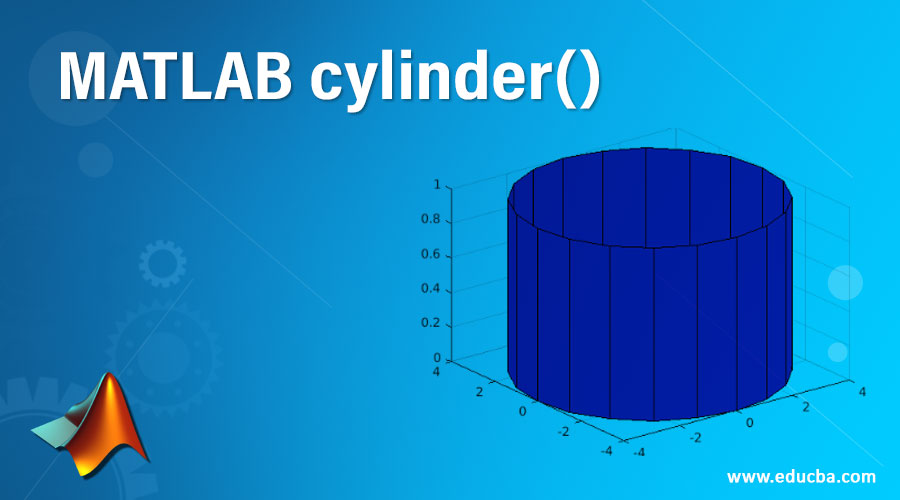
Introduction to MATLAB cylinder()
Cylinder() is an inbuilt 3D plotting function in MATLAB which is specific to generate the cylindrical objects. This function can be used to fetch the values for x, y, and z-coordinates of a cylinder without plotting the output or can be used to draw the cylinder depending on the input parameters given in the function call.
In MATLAB programming, the drawing of the cylindrical 3D plot object can be carried out by the retrieved x, y, and z- coordinates using surf() or mesh() function.
Syntax
The 3D surface plotting function, cylinder(), is supported with different syntaxes based on input parameters, provided to the function call. The table given below describes the different syntax for cylinder() function and their respective behavior:
| Syntax | Description |
| [X, Y,Z] = cylinder() | Implementation of this syntax enables the user to store x, y, and z-coordinates of the resultant cylinder and does not create the display. |
| [X, Y,Z] = cylinder(r) | Implementation of this syntax enables the user to store x, y, and z-coordinates of the resultant cylinder of radius ‘r’ and does not create the display. The default number of the spaced point: 20 |
| [X, Y,Z] = cylinder(r,n) | Implementation of this syntax enable the user to store x, y, and z-coordinates of the resultant cylinder of radius ‘r’ and ‘n’ number of spaced point and does not create the display. |
| cylinder | Implementation of this syntax enables the user to get the display of the resultant cylinder object and does not store x, y, and z-coordinates of it. |
| cylinder(ax,____) | Implementation of this syntax enables the user to get the display of the resultant cylinder object and does not store x, y, and z-coordinates of it. |
Examples to Implement MATLAB cylinder()
Below are the examples to implement for the same:
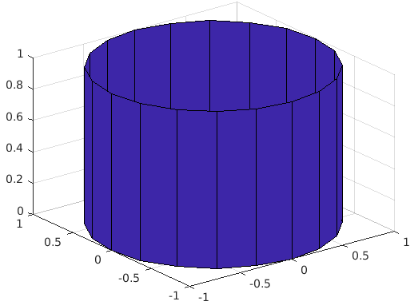
Example #1. Using [X, Y,Z] =cylinder()
The below code stores the x, y, and z-coordinates for the cylinder generated from the function cylinder() in [X, Y, Z] matrices.
Code:
[X,Y,Z] = cylinder();

surf(X,Y,Z)
Output:
![Using [X, Y,Z] =cylinder()](https://cdn.educba.com/academy/wp-content/uploads/2020/04/MATLAB-cylinder-1.png)
The function cylinder() has created a cylinder of radius ‘1’ and stored its x, y and z coordinate in the matrices [X, Y, Z]. The cylinder using the retrieved x, y, and z-coordinates is drawn using the function surf().
Example #2. Using [X, Y,Z] = cylinder(r)
The below code stores the x, y, and z-coordinates for the cylinder of radius ‘rad’, generated from the function cylinder(rad) in [P, Q, R] matrices.
Code:
rad=4;

[P,Q,R] = cylinder(rad);

surf(P,Q,R)
Output:
![Using [X, Y,Z] = cylinder(r)](https://cdn.educba.com/academy/wp-content/uploads/2020/04/MATLAB-cylinder-2.png)
The function cylinder() has created a cylinder of radius ‘4’ and stored its x, y, and z coordinates in the matrices [P, Q, R]. The cylinder using the retrieved x, y, and z-coordinates is drawn using the function surf().
Example #3. Using [X, Y,Z] = cylinder(r,n)
The below code stores the x, y, and z-coordinates for the cylinder of radius ‘rad’ and ‘num’ of spaced points, generated from the function cylinder(rad) in [P, Q, R] matrices.
Code:
rad=4;

num=5;

[P,Q,R] = cylinder(rad,num);

surf(P,Q,R)
Output:
![Using [X, Y,Z] = cylinder(r,n)](https://cdn.educba.com/academy/wp-content/uploads/2020/04/MATLAB-cylinder-3.png)
The function cylinder() has created a cylinder of radius ‘4’ and 5 number of spaced points and stored its x, y, and z coordinates in the matrices [P, Q, R]. The cylinder using the retrieved x, y, and z-coordinates is drawn using the function surf().
Example #4. Using cylinder
The below code draws the cylinder view generated by the function call cylinder.
Code:
cylinder
Output:
The command results in displaying a cylinder object having a radius of its circular base as ‘1’ and value of height as ‘1’.
Attributes
The attributes for the function cylinder() extends its functionality to support customization of the display of the object. Such attributes and their working objectives are described in the below table.
| Attribute | Description |
| Profile curive/ Radius (r) | This attribute is used to set the radius of the base of the cylinder. The default value of the radius is ‘1’ |
| Number of points (n) | This attribute is used to decide on the number of face points cylinder circumference for the cylinder display, created by the function ‘cylinder’ The default value for n is:20 |
| Target axes (ax) | This attribute enables the user to create the desired cylinder display on different target axes instead of default current axes. |
Example
The below code snippet is defined to generate a unit cylindrical plot with a different color.
Code:
[P,Q,R] = cylinder;

surf(P,Q,R,'facecolor',[0 1 0])
Output:
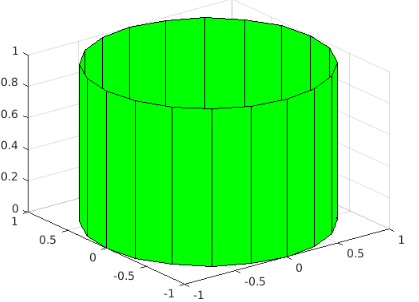
The resultant plot is drawn with a different color (light green).
Customizing the height of the plot
The object from cylinder function comes with the default value for height as ‘1’. The height can be altered by altering the value for z-coordinate.
The below code snippet is defined to generate a cylinder with different values of height.
Code:
[P,Q,R] = cylinder;

surf(P,Q,R+5)
Output:
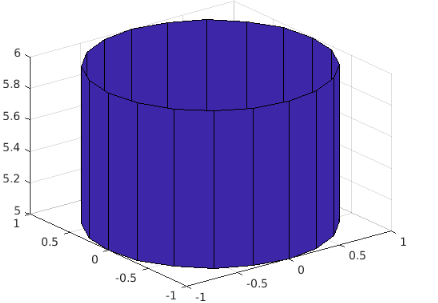
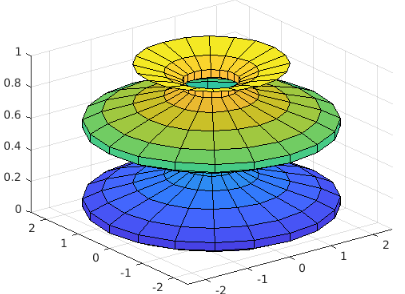
The resultant z-coordinate value is‘6’. Therefore, the resultant cylinder is displayed with a unit radius having value for height ‘6’.
Application of Cylinder
Application of Cylinder to create cylinder views with multiple radius:
MATLAB extends its feature for the function cylinder to create a cylinder object with multiple radius values for different faces of it. It is possible to achieve by using an expression with depending variable as the dynamic input value for the input parameter ‘r’.
Example
The below code stores the x, y, and z-coordinates as input matrices [P, Q, R] for the cylinder of radius ‘rad’, generated from the function cylinder(rad).
Code:
x = 0:pi/10:2*pi;

rad = 1.5 + sin(2.*x);

[P,Q,R] = cylinder(rad);

surf(P,Q,R)
Output:
The function cylinder(rad) has created a cylinder of radius ‘rad’, defined as a function of ‘x’ that equals ‘1.5 + sin(2.*x)’ and stored its x, y, and z coordinates in the matrices [P, Q, R]. The cylinder using the retrieved x, y, and z-coordinates are drawn using the function surf().
Additional Note: The orientation of the cylinder can be changed i.e. the cylinder can be placed horizontally following 2 different approaches such as:
- Changing the viewpoint and relabeling the axes.
- Implementing the function hgtransform() which performs rotation operation on the plot. In this case, the surfaces need to be parented by using the command: ‘surf(x,y,z,’Parent’, TheHGHandle)’
Recommended Articles
This is a guide to MATLAB cylinder(). Here we discuss an introduction to MATLAB cylinder() with appropriate syntax, attributes and examples for better understanding. You can also go through our other related articles to learn more –
