Updated February 28, 2023

Introduction to Matlab Plot Circle
MATLAB can be used to perform operations involving geometric figures like circles, rectangles, squares etc. In this article, we will focus on circles. We will learn how to create various types of circles in MATLAB. We can create solid or plane circles in MATLAB, which we will learn as we go ahead in the article. We will also learn how to create a circle using the rectangle function.
How to Create a circle using Rectangle Function?
Let us first learn syntax to draw a simple circle in MATLAB:
1. Let us first declare some points, here we are taking 500 points. The below code will create these points.
- angles = linspace(0, 2*pi, 500);
2. Let us now declare the radius and centre of the circle. The centre will be defined by x and y co-ordinates.
- radius = 20;
- CenterX = 50;
- CenterY = 40;
3. Finally, we will plot our circle.
- x = radius * cos(angles) + CenterX;
- y = radius * sin(angles) + CenterY;
4. We will also write some code for our output to look visually better. This is normal formatting and we can adjust it as per our requirement.
- plot(x, y, ‘b-‘, ‘LineWidth’, 2);
- hold on;
- plot(CenterX, CenterY, ‘k+’, ‘LineWidth’, 3, ‘MarkerSize’, 14);
- grid on;
- axis equal;
- xlabel(‘X’, ‘FontSize’, 14);
- ylabel(‘Y’, ‘FontSize’, 14);
5. This is how our input and output will look like in MATLAB console:
Code:
angles = linspace(0, 2*pi, 500);

radius = 20;

CenterX = 50;

CenterY = 40;

x = radius * cos(angles) + CenterX;

y = radius * sin(angles) + CenterY;

plot(x, y, 'b-', 'LineWidth', 2);

hold on;

plot(CenterX, CenterY, 'k+', 'LineWidth', 3, 'MarkerSize', 14);

grid on;

axis equal;

xlabel('X', 'FontSize', 14);

ylabel('Y', 'FontSize', 14);
Output:
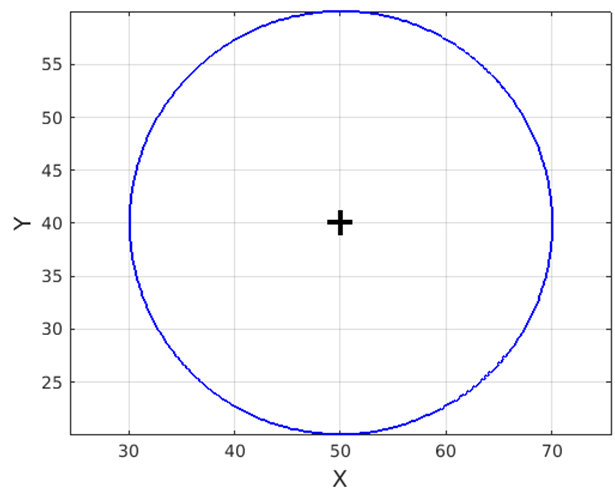
As we can see in the above output, the circle is created with a radius 20 and centre (50, 40) as defined by us in the code.
How to Create a Solid 2D Circle in MATLAB?
Next, let us learn how to create a solid 2D circle in MATLAB:
1. First, we will be creating logical image of circle. For this, we will define center, diameter and the image size. Let us first create image.
- imageSizeOfX = 640;
- imageSizeOfY = 480;
- [colInImage rowsInImage] = meshgrid(1 : imageSizeOfX, 1 : imageSizeOfY);
2. Next, we will be creating the circle inside the image.
- centerOfX = 320;
- centerOfY = 240;
- radius = 80;
- Pixels = (rowsInImage – centerOfY).^2 …
- + (colInImage – centerOfX).^2 <= radius.^2;
3. In the above line of code, Pixels is “logical” array and is 2D. Let us now display ‘Pixels’.
- image(Pixels);
- colormap([0 0 0; 1 1 1]);
- title(‘Image of circle’);
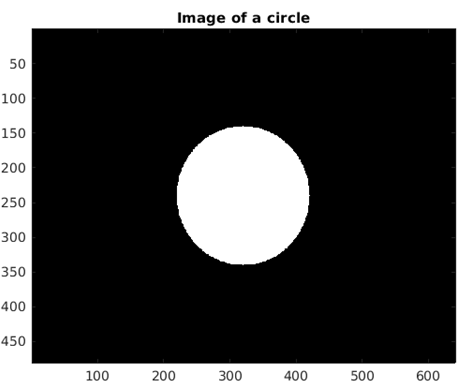
4. This is how our input and output will look like in MATLAB console:
Code:
imageSizeOfX = 640;

imageSizeOfY = 480;

[colInImage rowsInImage] = meshgrid(1 : imageSizeOfX, 1 : imageSizeOfY);

centerOfX = 320;

centerOfY = 240;

radius = 80;

Pixels = (rowsInImage - centerOfY).^2 ...

+ (colInImage - centerOfX).^2 <= radius.^2;

image(Pixels);

colormap([0 0 0; 1 1 1]);

title('Image of circle');
Output:
How to create a Circle in MATLAB Using Rectangle Function?
Let us now learn how to create a circle in MATLAB using rectangle function: Here is a simple code to achieve this:
1. Like we discussed in above examples, we will declare the radius and centre co-ordinates of the required circle.
- radius = 6;
- centerX = 30;
- centerY = 40;
- rectangle(‘Position’,[centerX – radius, centerY – radius, radius*2, radius*2],…
- ‘Curvature’,[1,1],…
- ‘FaceColor’,’b’);
- axis square;
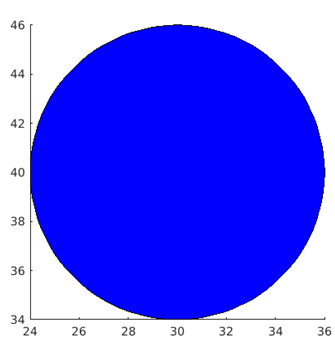
2. We have passed ‘FaceColor’ as “b” so our output circle will be of Blue colour.
Code:
radius = 6;

centerX = 30;

centerY = 40;

rectangle('Position',[centerX - radius, centerY - radius, radius*2, radius*2],...

'Curvature',[1,1],...

'FaceColor','b');

axis square;
Output:
How we can Create a Simple arc in MATLAB?
Finally, let us discuss how we can create a simple arc in MATLAB. As we know that arc is nothing but a small portion of the circle, code for creating an arc is also very similar to that of creating a circle.
1. First we define the parameters of required arc.
- xCenter = 1;
- yCenter = 1;
- radius = 4;
2. Next, we define the angle theta as required.
- theta = linspace(20, 100, 50);
- x = radius * cosd(theta) + xCenter;
- y = radius * sind(theta) + yCenter;
3. Finally, we plot our defined points.
- plot(x, y, ‘b-‘, ‘LineWidth’, 2);
- axis equal;
- grid on;
Code:
xCenter = 1;

yCenter = 1;

radius = 4;

theta = linspace(20, 100, 50);

x = radius * cosd(theta) + xCenter;

y = radius * sind(theta) + yCenter;

plot(x, y, 'b-', 'LineWidth', 2);

axis equal;

grid on;
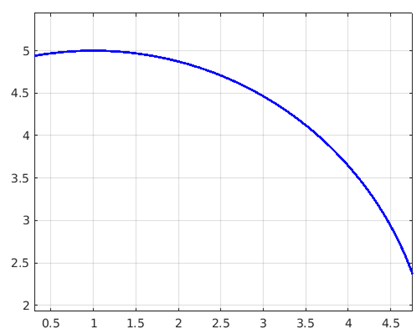
Output:
Conclusion
So, in this article, we learnt how to create circles in MATLAB. We can create both plane circles and solid circles in MATLAB. We also learnt how we can leverage the Rectangle function to plot circles in MATLAB. We can also format our circle as per our requirement.
Recommended Articles
This is a guide to Matlab Plot Circle. Here we discuss an introduction, how to Create a circle using rectangle function, a Solid 2D Circle, a circle in MATLAB and Simple arc. You can also go through our other related articles to learn more –
