Updated June 30, 2023

Introduction to Matlab Plot Multiple Lines
A line drawn with Matlab is feasible by incorporating a 2-D plot function plot() that creates a two-dimensional graph for the dependent variable concerning the dependent variable. Matlab supports plotting multiple lines on single 2D plane. The lines drawn from plot function can be continuous or discrete by nature. The lines for data Y1, Y2,…, Yn concerning their corresponding set of data X1, X2,.., Xn. Matlab can generate multiple 2D line plots using the plot function within a loop. The customization of the plots is also feasible by altering different attributes of the plot function.
Syntax:
The general syntax to plot multiple lines within a single plan is:
plot(X1,Y1,...,Xn,Yn)Whereas depending on the attributes used to customize the display of the lines, the syntax is defined as:
plot(X1,Y1,LineSpec1,...,Xn,Yn,LineSpecn)This syntax sets each line’s line style, marker type, and color. LineSpeci gets applied to the data pair Xi, Yi.
plot(___,Name,Value)This syntax is used to apply customization to display the lines using name-value pair arguments.
Examples of Matlab Plot Multiple Lines
Given below are the examples mentioned:
Example #1
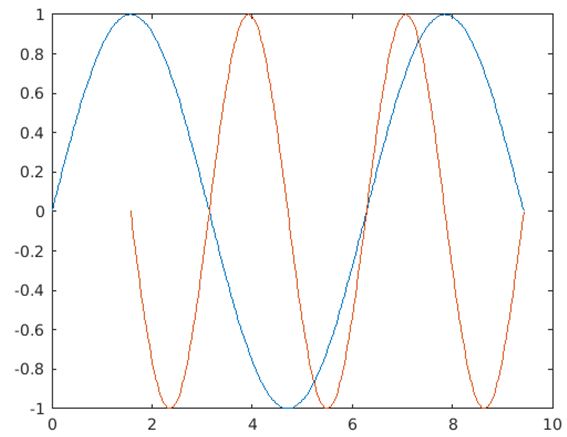
Let’s create 2 line plots for 2 functions y1=sin(x1) and y2=sin(2*x2) where x1 ranges from 0 to 3*pi x2 ranges from pi/2 to 3*pi.
Code:
x1=0:pi/100:3*pi;
x2=pi/2:pi/100:3*pi;
y1=sin(x1);
y2=sin(2*x2);
figure
plot(x1,y1,x2,y2)
Output:
The resultant plot consists of 2 sinusoidal line curves, ‘y1’ and ‘y2′, having two different sets of values’,x1′ and ‘x2’, but share a common x-y plane.
The customization of the lines drawn from single plot functions can be achieved by altering any of the attributes or any combination of the attributes described below:
a. xlabel: Add labels to the x-axis.
b. Ylabel: Add labels to the y-axis.
c. Title: Update the title for the graph.
d. Grid on: Makes the grid lines visible for the graph.
e. Axis equal: The plots can be created with a common scale factor and spaces for both axis.
f. Axis square: A set of square plots can be generated.
The example defined below demonstrates the process of customization of the presentation of the graph by modifying the attributes given above.
Code:
x=0:pi/100:2*pi;
y1=sin(x);
y2=cos(2*x);
%Adding x-label, y-label and title to the resultant plot
plot(x, y1,x,y2), xlabel('x-axis'), ylabel('y-axis'), title('Graph customisation'),
Output:

g. Axis scaling
The limit values for the plots can be imposed on the axes using the command ‘axis’.
Syntax to incorporate axes limit:
axis ( [xminxmaxyminymax] )Example:
x = [0 : 0.1: 20];
y1 = exp(-x).*cos(2*x);
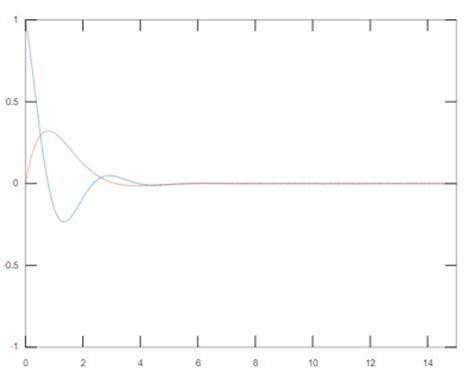
y2= exp(-x).*sin(x);Case 1:
%x-axis maximum value 15
%x-axis minimum value 0
%y-axis minimum value -1
%x-axis maximum value 1
Code:
plot(x, y1,x,y2), axis([0 15 -1 1])Output:
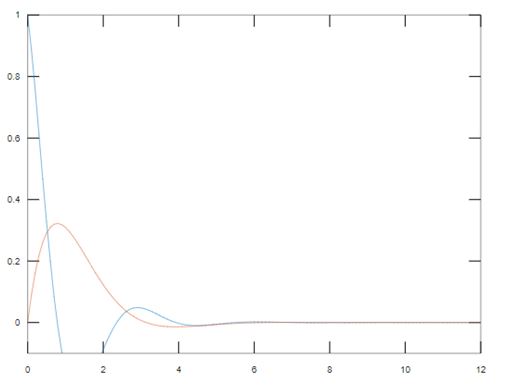
Case 2:
%The minimum value of the y-axis gets updated to -0.1 and the maximum value for the x-axis is updated to 12.
Code:
plot(x, y1,x,y2), axis([0 12 -0.1 1])Output:
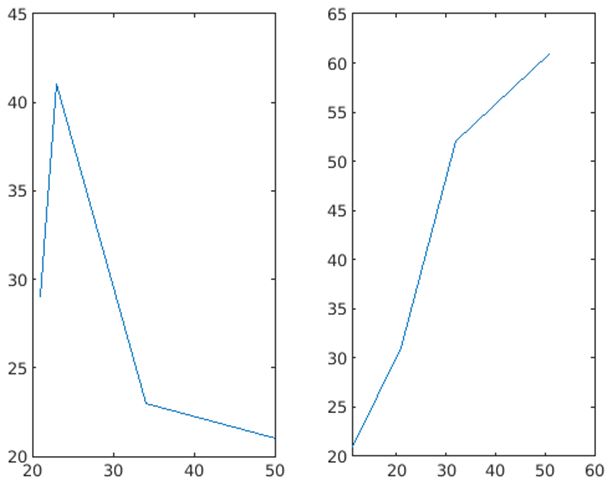
h. Arranging multiple line plots in different subplots: Matlab supports presenting the line plots generated in a single execution with a distinct set of axes.
The below example presents 2 line plots generated from one single execution of the program with two different sets of axes.
Code:
x1=[21 23 34 50];
y1=[29 41 23 21];
x2=[11 21 32 51 ];
y2= [ 21 31 52 61];
%Placing the first line plot in the first cell of the frame
subplot(1,2,1)
plot(x1,y1)
hold on
%Placing the second line plot in the second cell of the frame
subplot(1,2,2)
plot(x2,y2)
hold off
Output:
i. Including legend to distinguish the line plots: Application of the attribute ‘legend’ adds information to the plot to guide the user in identifying the lines with respect to their plotting functions.
The code displays the data mapping each line to its corresponding plotting function.
Code:
x = [0 :pi/100:2*pi];
y1 = sin(2*x);
y2 = cos(2*x+pi);
plot(x, y1, x, y2, '.-'), legend('Sin(2x)', 'Cos(2x+pi)')
Output:

Example #2
Generating multiple lines using a loop.
Matlab enables users to plot more than two lines in a single plane. This can also be achieved by calling the plot function in a loop where the plotting function can be defined as a function of the looping variable.
The code snippet below generates six lines for the function defined by ‘y’, the looping variable’ x’ function.
Code:
t = [25 50 75 100 125 150]
for i=1:length(t);
x=[20 23 45 56 30 12];
y= x*i+5;
figure(1)
hold on
plot(x,y,'LineWidth',2)
end
Output:

Example #3
Displaying markers for specific data points for the lines.
Markers help point out distinct data points on the plotted line to determine the exact values calculated from the function. In the case of a graph containing lines more than three and having overlapped presentation, it helps to determine which data point belongs to which plot.
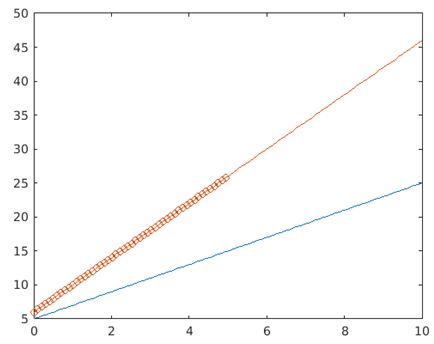
The below example generates 2 line plots, and we highlight one plot with the marker symbol ‘-o’.
Code:
x = linspace(0,10);
y1 = 2*x+5;
y2=4*x+6;
plot(x,y1,x,y2,'-o','MarkerIndices',1:1:50)
Output:
Example #4
Customizing the presentation of the lines after the creation of the plot.
Matlab extends its feature in 2D line plots to customize the plot presentation through the execution even after the plot is generated. The generated plot gets assigned to a chart line object, and its display gets customized by altering the attributes from the storing chart line object.
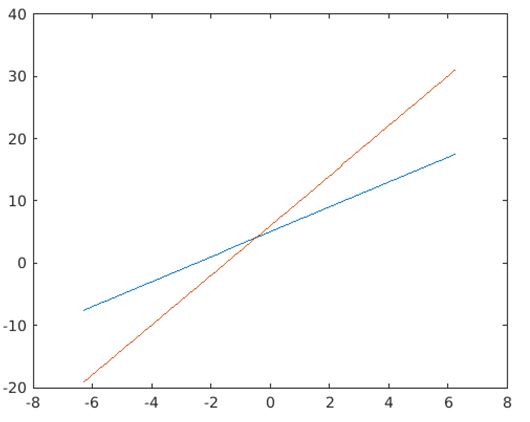
The code below generates two linear curves and edits the display of the graphs by altering the attributes of the chart line object.
Phase 1: Creation of the plots.
Code:
x = linspace(-2*pi,2*pi);
y1 = 2*x+5;
y2=4*x+6;
p = plot(x,y1,x,y2);
Output:
Phase 2: Editing the plot display using attributes from the chart line object ‘p’.
Code:
p(1).LineWidth = 2;
p(2).Marker = '*';
Output:

Conclusion
Generating multiple lines using Matlab 2D plot function improves the code quality of the programming and optimizes the code size. It helps visualize data points, carry out data analysis operations, and perform various types of comparative analysis on the available data point.
Recommended Articles
We hope that this EDUCBA information on “Matlab Plot Multiple Lines” was beneficial to you. You can view EDUCBA’s recommended articles for more information.
