EDUCBA

EDUCBA

MENUMENU
  • Free Tutorials
  • Free Courses
  • Certification Courses
  • 360+ Courses All in One Bundle
  • Login

Matlab mesh()

By Priya PedamkarPriya Pedamkar

Home » Data Science » Data Science Tutorials » Matlab Tutorial » Matlab mesh()

Matlab mesh()

Introduction to Matlab mesh()

The Matlab built-in function mesh() is a 3D plotting function to create 3- dimensional surface plot with respect to the values from the input matrix. The plot generated from mesh() is a surface graphic object which is wireframe parametric by nature. This function maps the input matrix values to color values, generating color maps. The height of the plot depends on the input matrix value, above to x-y plane that can be defined by X, Y coordinate inputs. The color for the plot is determined depending on the surface height.

Syntax:

Start Your Free Data Science Course

Hadoop, Data Science, Statistics & others

This 3D surface plotting function can be implement with different syntaxes depending on input arguments, provided to the function call.

Different syntax and their respective input arguments are described in the below table:

Syntax Description
mesh(Z) It is used to generate 3D surface plot of which x, y co-ordinates are decided by column and row indices of the input matrix ‘Z’.
mesh(Z,C) It is used to generate 3D surface plot for input matrix ‘Z’ with the color for the edges set to ‘C’.
mesh(X,Y,Z) It is used to generate 3D surface plot of which height is determined by the values in the input matrix ‘Z’ and the x-y plane is set by X and Y.
mesh(X,Y,X,C) It is used to generate 3D surface plot of which on the x-y plane, set by X and Y, with edge color ‘C’.
mesh(ax,____) It is used to generate the 3D surface plot with the new axis ‘ax’.
mesh(__,name, value) It is used to set surface properties for the plot using name-value pair argument format.
Cs=mesh(___) It is used to store the 3D plot generated from the function mesh() in chart surface object. The object can be used to modify the surface object properties after the plot is generated.

Examples of Matlab mesh()

Given below are the examples mentioned:

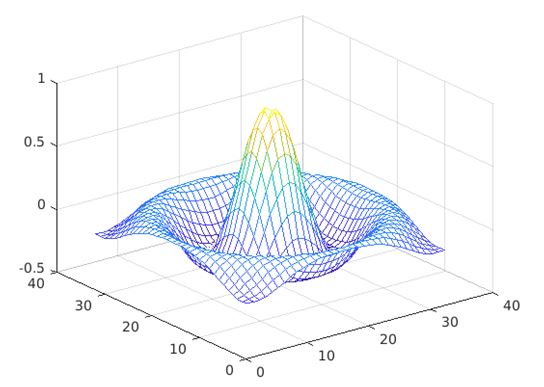
Example #1 – Using mesh(Z)

The below code snippet is used to generate 3D plot for the input matrix ‘I’ which is function of x-coordinate ‘P’ and y-co-ordinates ‘R’ providing ‘I’ as single input argument to the mesh() function call.

Code:

[P,Q] = meshgrid(-8:.5:8);
R = sqrt(P.^2 + Q.^2);
I = sin(R)./R;
mesh(I)

Output:

The plot is generated with the default color value depending on the data values in the input matrix.

matlab mesh() 1

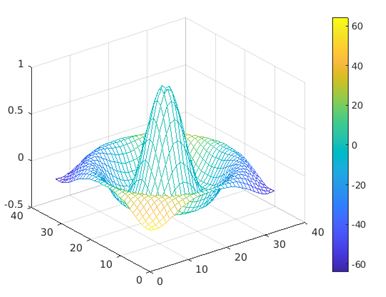
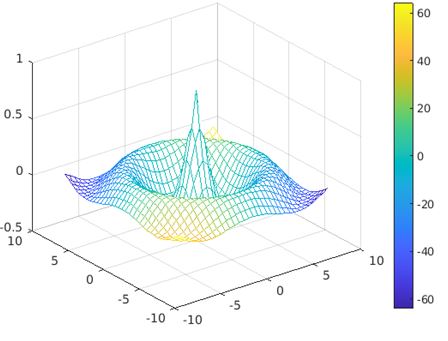
Example #2 – Using mesh(Z, C)

The below set of command is defined to change the color of the same plot generated in the previous function defining the input argument ‘C’.

Popular Course in this category
Sale
MATLAB Training (3 Courses, 1 Project)3 Online Courses | 1 Hands-on Project | 8+ Hours | Verifiable Certificate of Completion | Lifetime Access
4.5 (9,206 ratings)
Course Price

View Course

Related Courses
R Programming Training (13 Courses, 20+ Projects)All in One Data Science Bundle (360+ Courses, 50+ projects)

Code:

[P,Q] = meshgrid(-8:.5:8);
R = sqrt(P.^2 + Q.^2);
I = sin(R)./R;
C = P.*Q;
mesh(I,C)
colorbar

Output:

The color value is set by the input argument ‘C’ which is being designed as function of the x,y coordinates ‘P’ and ‘Q’.

using (Z, C)

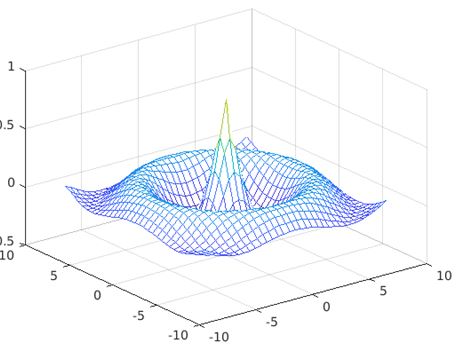
Example #3 – Using mesh(X, Y, Z)

The code written below generates 3D surface plot from mesh() function which accepts 3 input arguments i.e. input matrix ‘Z’ , x,y coordinate inputs ‘P’ and ‘Q’.

Code:

[P,Q] = meshgrid(-8:.5:8);
R = sqrt(P.^2 + Q.^2) + eps;
Z = cos(R)./(R+1.2);
mesh(P,Q,Z)

Output:

using (X, Y, Z)

Example #4 – Using mesh(X, Y, Z, C)

The below set of command is defined to change the color of the same plot generated in the previous function defining the input argument ‘C’.

Code:

[P,Q] = meshgrid(-8:.5:8);
R = sqrt(P.^2 + Q.^2) + eps;
Z = cos(R)./(R+1.2);
C = P.*Q;
mesh(P,Q,Z,C)
colorbar

Output:

The color value is set by the input argument ‘C’ which is being designed as function of the x,y coordinates ‘P’ and ‘Q’.

(X, Y, Z, C)

Example #5 – Using mesh(__,name, value)

Matlab supports the feature to alter the display of the generated plot using name-value pairing format in mesh() function. The attribute given as name in the pair gets set with the data given as value in the function call.

Some of the attributes which can be altered to customize the plot, are given in the table below:

Attribute Description
EdgeColor The attribute is used to decide the color for the edge lines of the plot. Possible values are none, flat, interp, RGB triplets, color name etc.
LineStyle It is used to set the line style for the representation of the 3D surface plot. Possible values are‘-‘ (solid line), ‘- -‘ (dashed line) , ‘:’ (dotted line) etc.
FaceColor This attribute customize the face of the color in the plot. Possible values are flat, interp, RGB triplets, texture map, hexadecimal color code etc.
FaceAlpha It decides the degree of transparency for the faces of the plot. Possible values are any value between 0 to 1.
FaceLighting This attribute is used to decide the effect of the light objects on the plot faces. Possible values are flat, gouraud, none etc.
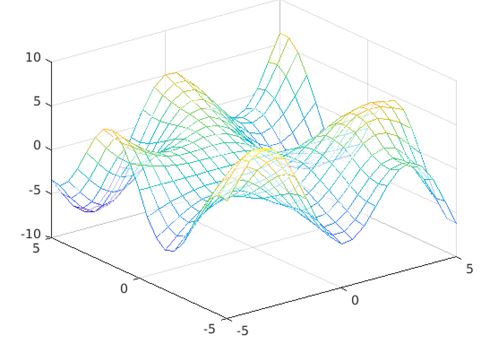
a. With FaceAlpha=0.6

The transparency of the faces of the plot is resulted with FaceAlpha being set to 0.6.

Code:

[P,Q] = meshgrid(-5:.5:5);
R = Q.*cos(P) - P.*sin(Q);
mesh(P,Q,R,'FaceAlpha','0.6')

Output:

matlab mesh() 5JPG

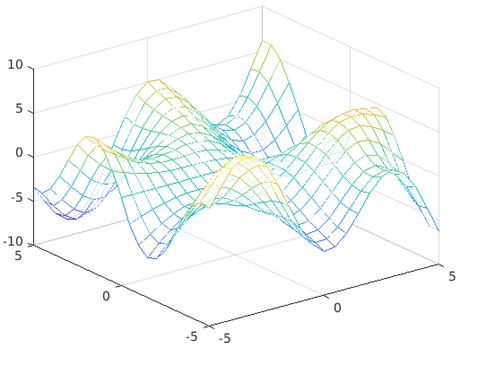
b. With facealpha=0.8

Code:

[P,Q] = meshgrid(-5:.5:5);
R = Q.*cos(P) - P.*sin(Q);
mesh(P,Q,R,'FaceAlpha','0.8')

The transparency of the faces of the plot is changed as value for FaceAlpha is updated from 0.6 to 0.8.

Output:

With facealpha=0.8

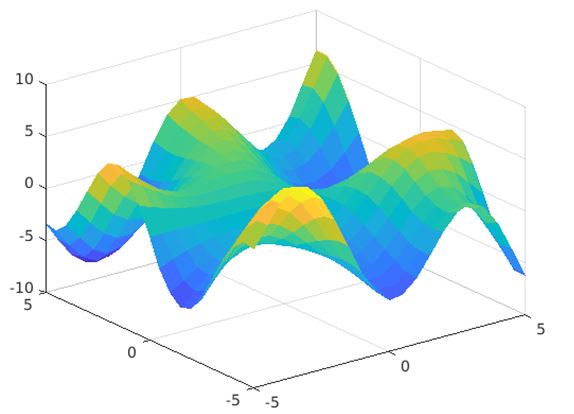
c. With Facecolor=flat

Code:

[P,Q] = meshgrid(-5:.5:5);
R = Q.*cos(P) - P.*sin(Q);
mesh(P,Q,R,'FaceColor','flat')

Output:

The resultant plot is presented with faces having different color for each face depending on the value present in CData property.

matlab mesh() 7JPG

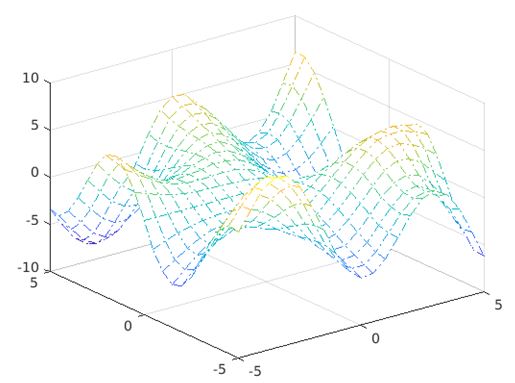
Example #6 – Using Cs=mesh(___)

The below code returns surface object from the function which is stored in the chart surface object ‘cs’. The display of the plot is altered by modifying the value for EdgeColor and LineStyle by calling the attributes through ‘cs’ object.

Code:

[P,Q] = meshgrid(-5:.5:5);
R = Q.*cos(P) - P.*sin(Q);
cs=mesh(P,Q,R);
cs.EdgeColor='interp';
cs.LineStyle='-.'

Output:

The resultant plot is represented having edges with interpolated coloring depending on the values in the CData property and the lines are displayed following the style format ‘-.’.

matlab mesh() 8JPG

Additional Note:

  • The default behavior of Matlab regarding the plot generation using mesh() function is it computes the color limits depending on the minimum and maximum value of from the input matrix. The intermediate values get mapped to the current color map by means of the process of linear transformation, performed by Matlab.
  • In the process of generating the surface plot, the simulation of hidden surface elimination is carried out by ‘hidden’ command and that of shading model is controlled by ‘shading command’.

Recommended Articles

This is a guide to Matlab mesh(). Here we discuss the introduction to Matlab mesh() with examples with better understanding. You may also have a look at the following articles to learn more –

    1. Meshgrid in Matlab
    2. Nested Loop in Matlab
    3. Matlab Plot Circle
    4. Summation in Matlab

MATLAB Training (3 Courses, 1 Project)

3 Online Courses

1 Hands-on Project

8+ Hours

Verifiable Certificate of Completion

Lifetime Access

Learn More

0 Shares
Share
Tweet
Share
Primary Sidebar
Matlab Tutorial
  • Advanced
    • MATLAB Class
    • Arrays in MATLAB
    • Matlab find value in array
    • Power Spectral Density MATLAB
    • Matlab Textscan
    • String Array in MATLAB
    • MATLAB Random Numbers
    • Matlab Dot
    • MATLAB 2D Array
    • MATLAB? zero padding
    • MATLAB sort matrix
    • MATLAB Plot Function
    • 2D Plots in MATLAB
    • 3D Plots in MATLAB
    • MATLAB Fread
    • Spectrogram MATLAB
    • MATLAB Average
    • MATLAB exponent
    • MATLAB not enough input arguments
    • MATLAB comment
    • MATLAB zpk
    • Scatter Plots in MATLAB
    • MATLAB 3d scatter plot
    • Bar Graph in MATLAB
    • Bar Plot MATLAB
    • Log Plot MATLAB
    • Polar Plot in MATLAB
    • Surface Plot in MATLAB
    • MATLAB Plot Circle
    • Boxplot in MATLAB
    • MATLAB Plot Multiple Lines
    • Linspace MATLAB
    • Histogram in MATLAB
    • Plot Vector MATLAB
    • MATLAB Legend
    • MATLAB Plot Legend
    • MATLAB ezplots
    • Column Vector MATLAB
    • MATLAB Plot Marker
    • MATLAB LineWidth
    • MATLAB Line Style
    • Contour plot in MATLAB
    • MATLAB Sine Wave
    • Reshape in MATLAB
    • Natural Log in MATLAB
    • Random Number Generator in MATLAB
    • Complex Numbers in MATLAB
    • MATLAB Figure
    • Heatmap in MATLAB
    • MATLAB Technical Computing
    • Colors in MATLAB
    • Colormap in MATLAB
    • MATLAB Plot Colors
    • MATLAB fplot()
    • MATLAB Stacked Bar
    • MATLAB sphere()
    • MATLAB cylinder()
    • MATLAB mesh()
    • Pie Chart in MATLAB
    • MATLAB Gradient
    • Grid on MATLAB
    • Repmat in MATLAB
    • dlmread in MATLAB
    • Meshgrid in MATLAB
    • MATLAB Struct
    • MATLAB Cross Product
    • MATLAB colorbar Label
    • MATLAB Save Variable
    • MATLAB Saveas
    • MATLAB Cell Array
    • Polynomial in MATLAB
    • ismember MATLAB
    • Heaviside MATLAB
    • MATLAB rref
    • MATLAB polyfit()
    • MATLAB xlim
    • MATLAB Variance
    • Optimset MATLAB
    • Quiver MATLAB
    • Newton Raphson MATLAB
    • Mat2cell MATLAB
    • Magnitude MATLAB
    • format long MATLAB
    • Dot Product MATLAB
    • Jacobian MATLAB
    • What is Matlab?
    • Convolution MATLAB
    • Moving Average MATLAB
    • Fourier Series MATLAB
    • Gaussian Fit MATLAB
    • Bisection Method MATLAB
    • Laplace Transform MATLAB
    • Fourier Transform MATLAB
    • Signal Processing MATLAB
    • MATLAB Forms
    • Complex Conjugate MATLAB
    • MATLAB Write to File
    • uigetfile MATLAB
    • MATLAB Toolbox
    • MATLAB Errorbar
    • MATLAB Index Exceeds Matrix Dimensions
    • Nyquist MATLAB
    • Impulse Response MATLAB
    • xlsread MATLAB
    • MATLAB xlswrite
    • Matplotlib Scatter
    • MATLAB Import Data
    • MATLAB Export Data
    • MATLAB Read CSV
  • Basic
    • MATLAB Area Under Curve
    • MATLAB not equal
    • MATLAB max
    • MATLAB exist
    • MATLAB Table
    • MATLAB regression
    • MATLAB Lists
    • MATLAB quantile
    • MATLAB Round
    • MATLAB readtable
    • MATLAB disp
    • MATLAB Standard Deviation
    • MATLAB quadprog
    • MATLAB Transpose
    • Introduction to MATLAB
    • Advantages of MATLAB
    • MATLAB Features
    • Taylor Series MATLAB
    • MATLAB Z Transform
    • fsolve in MATLAB
    • Is MATLAB Free
    • MATLAB QR
    • Career in MATLAB
    • Uses Of MATLAB
    • Is MATLAB Free
    • How to Install MATLAB
    • How to Use MATLAB?
    • MATLAB Version
    • MATLAB Compiler
    • MATLAB Commands
    • MATLAB Block Comment
    • MATLAB? sprintf
    • MATLAB fprintf
    • Data Types in MATLAB
    • MATLAB Integral
    • MATLAB Double Integral
    • MATLAB boolean
    • MATLAB vpa
    • MATLAB Object
    • MATLAB Annotation
    • MATLAB Variables
    • MATLAB Global Variables
    • MATLAB Operators
    • MATLAB Logical Operators
    • MATLAB nan
    • MATLAB Patch
    • MATLAB AND Operator
    • MATLAB OR Operator
    • Vectors in MATLAB
    • What is Simulink in MATLAB
    • MATLAB Interpolation
    • MATLAB Imread
    • fscanf MATLAB
    • Euler Method MATLAB
    • Root Locus MATLAB
    • MATLAB return
    • Bode Plot MATLAB
    • Nargin MATLAB
    • MATLAB Matrix Inverse
    • MATLAB String to Number
    • MATLAB string
    • MATLAB ColorBar
    • MATLAB Surfc
    • MATLAB Concatenate
    • NUMEL MATLAB
    • MATLAB? File Extension
    • MATLAB File
    • MATLAB Smooth
    • MATLAB ones
    • Exponential in MATLAB
    • MATLAB ksdensity
    • MATLAB log
    • MATLAB Append
    • MATLAB hold on
    • MATLAB Magnitude of Vector
    • Heatmap in MATLAB
    • MATLAB xticks
    • MATLAB randn
  • Control Statements
    • IF-Else Statement in MATLAB
    • If Statement in MATLAB
    • Loops in MATLAB
    • For Loop in MATLAB
    • While Loop in MATLAB
    • do while loop in MATLAB
    • Nested Loop in MATLAB
    • Switch Statement in MATLAB
    • Break in MATLAB
  • Functions
    • MATLAB Functions
    • MATLAB user defined function
    • Calling Functions in MATLAB
    • Transfer Functions in MATLAB
    • Anonymous Functions in MATLAB
    • Inline Functions in MATLAB
    • Bessel Functions in MATLAB
    • Mean Function in MATLAB
    • Find Function MATLAB
    • Filter Function in MATLAB
    • IIR Filter MATLAB
    • Piecewise Function in MATLAB
    • Sum Function in MATLAB
    • Simulink MATLAB Function
    • MATLAB Create Function
    • MATLAB Inverse Function
    • MATLAB Count
    • Step Function MATLAB
    • MATLAB limit
    • fminsearch in MATLAB
    • Covariance in MATLAB
    • Summation in MATLAB
    • Linear Fit MATLAB
    • MATLAB?linear regression
    • MATLAB Derivative
    • MATLAB Derivative of Function
    • MATLAB Comet()
    • Fzero MATLAB
    • xlabel MATLAB
    • Matplotlib Legend
    • Matplotlib Subplots
    • Plot graph MATLAB
    • MATLAB Format
    • MATLAB plot title
    • Multiple Plots in MATLAB
    • MATLAB Indexing
    • Ceil MATLAB
    • Curve Fitting MATLAB
    • MATLAB trapz()
    • MATLAB Normalize
    • MATLAB diff
    • MATLAB sym()
    • MATLAB Syms
    • Absolute Value MATLAB
    • MATLAB Exponential
    • Kalman Filter MATLAB
    • Low Pass Filter MATLAB
    • Bandpass Filter MATLAB
    • MATLAB Unique
    • Trapezoidal Rule MATLAB
    • MATLAB Root Finding
    • MATLAB stem()
    • MATLAB loglog()
    • MATLAB Autocorrelation
    • MATLAB Sort
    • Simplify MATLAB
    • Cumsum MATLAB
    • Eval Function MATLAB
    • Polyval MATLAB
    • MATLAB Colon
    • MATLAB Eigenvalues
    • MATLAB fit
    • Delta Function MATLAB
    • MATLAB Remainder
    • Differentiation in MATLAB
    • Permute MATLAB
    • isempty MATLAB
    • MATLAB text()
    • MATLAB Display Text
    • Varargin in MATLAB
    • MATLAB gca
    • MATLAB fill()
    • MATLAB pcolor()
    • MATLAB min
    • MATLAB xcorr
    • MATLAB? color codes
    • Semilogy MATLAB
    • MATLAB? eye
    • feval MATLAB
    • num2str in MATLAB
    • MATLAB Images
    • MATLAB Image? Segmentation
    • Imagesc MATLAB
    • MATLAB Image Processing
    • MATLAB Image Resize
    • MATLAB Flag
    • MATLAB fopen
    • Strcmp MATLAB
    • MATLAB fwrite
    • MATLAB fft()
    • MATLAB zeros()
    • MATLAB textread
    • Arctan MATLAB
    • MATLAB Scripts
    • Butterworth filter MATLAB
    • MATLAB Findpeaks
    • MATLAB find Index
    • MATLAB Cell
    • MATLAB Unit Step Function
    • MATLAB Backslash
    • MATLAB Mod
    • Size Function in MATLAB
    • Secant MATLAB
  • Matrix
    • Matrix in MATLAB
    • 3D Matrix in MATLAB
    • Transpose Matrix MATLAB
    • Sparse Matrix in MATLAB
    • Matrix Multiplication in MATLAB
    • Identity Matrix in MATLAB
    • MATLAB?writematrix
  • Programs
    • Square Root in MATLAB
    • Square Wave MATLAB
    • Squeeze MATLAB
    • Factorial in MATLAB
    • Cell to String MATLAB
  • Interview Questions
    • MATLAB Interview Questions

Related Courses

MATLAB Certification Course

R Programming Course

All in One Data Science Courses

Footer
About Us
  • Blog
  • Who is EDUCBA?
  • Sign Up
  • Live Classes
  • Corporate Training
  • Certificate from Top Institutions
  • Contact Us
  • Verifiable Certificate
  • Reviews
  • Terms and Conditions
  • Privacy Policy
  •  
Apps
  • iPhone & iPad
  • Android
Resources
  • Free Courses
  • Database Management
  • Machine Learning
  • All Tutorials
Certification Courses
  • All Courses
  • Data Science Course - All in One Bundle
  • Machine Learning Course
  • Hadoop Certification Training
  • Cloud Computing Training Course
  • R Programming Course
  • AWS Training Course
  • SAS Training Course

© 2022 - EDUCBA. ALL RIGHTS RESERVED. THE CERTIFICATION NAMES ARE THE TRADEMARKS OF THEIR RESPECTIVE OWNERS.

EDUCBA
Free Data Science Course

Hadoop, Data Science, Statistics & others

*Please provide your correct email id. Login details for this Free course will be emailed to you

By signing up, you agree to our Terms of Use and Privacy Policy.

EDUCBA
Free Data Science Course

Hadoop, Data Science, Statistics & others

*Please provide your correct email id. Login details for this Free course will be emailed to you

By signing up, you agree to our Terms of Use and Privacy Policy.

EDUCBA Login

Forgot Password?

By signing up, you agree to our Terms of Use and Privacy Policy.

Let’s Get Started

By signing up, you agree to our Terms of Use and Privacy Policy.

EDUCBA

*Please provide your correct email id. Login details for this Free course will be emailed to you

By signing up, you agree to our Terms of Use and Privacy Policy.

This website or its third-party tools use cookies, which are necessary to its functioning and required to achieve the purposes illustrated in the cookie policy. By closing this banner, scrolling this page, clicking a link or continuing to browse otherwise, you agree to our Privacy Policy

Loading . . .
Quiz
Question:

Answer:

Quiz Result
Total QuestionsCorrect AnswersWrong AnswersPercentage

Explore 1000+ varieties of Mock tests View more

Independence Day Offer - MATLAB Training (3 Courses, 1 Project) Learn More