Updated February 28, 2023
Introduction to Plot Vector Matlab
MATLAB provides us with plenty of functionalities, useful in various computational problems. In this article we will learn how to create vector plots in MATLAB. First let us understand why we need to plot the vectors. We create plots for visualizing our data Data visualization is useful in getting a high-level understanding of the data Data plots to have a wide range of uses; comparing a large amount of data, tracking changes in data over time
Syntax
Plot (A, B)
Explanation: This function will plot vectors A & B, with the condition that both A & B should be of the same length Simply put, a plot will be created between data points in A versus B.
TABLE 1: For line styles
| Line style | Pattern |
| – | Solid |
| — | Dashed |
| : | Dotted |
| -. | Dash and dot |
TABLE 2: For color
| Color Code | Color |
| Y | Yellow |
| C | Cyan |
| G | Green |
| B | Blue |
| M | Magenta |
| K | Black |
| W | White |
Examples to Implement Plot Vector Matlab
Here are the examples:
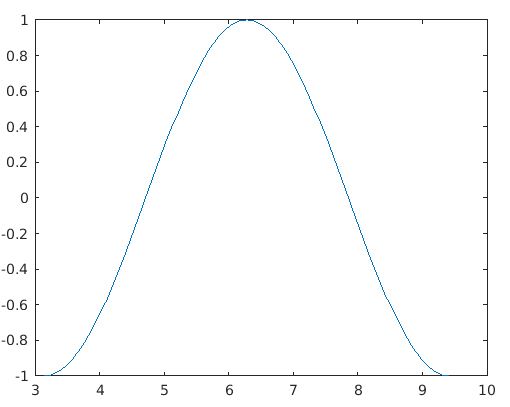
Example #1
First, we will define ‘A’ as a vector containing values between pi (π) and 3π. We will define an increment of π/100 between these values. Next, we will define B as the cos function of values of A. Our inputs A & B are then passed as arguments to the function plot (A, B). This is how our input and output will look like in MATLAB console:
Code:
A = pi : pi/100 : 3*pi;

B = cos (A);

figure

plot(A,B)
Output:
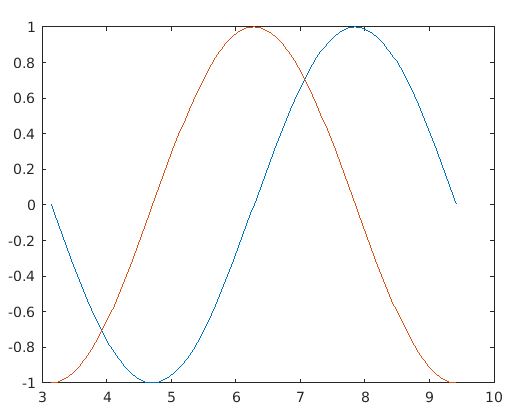
Example #2
Let us understand this with the help of ‘A’ that we used in the above example. Additionally, we will define ‘b’ and ‘c’ as 2 more vectors with sine & cos values of A respectively. Our inputs A, b & c are then passed as arguments to our function. This is how our input and output will look like in MATLAB console:
Code:
A = pi : pi/100 : 3*pi

b = sin (A);

c = cos (A);

figure

plot(A,b,A,c)
Output:
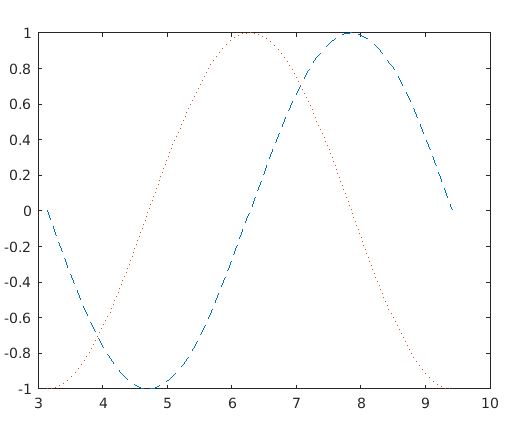
Example #3
Next, what if we need to visualize these 2 plots obtained side by side in some other style. That is, is there a way to define the style of plots? Yes, there is, we simply need to pass the pre-defined line style in the argument of our plot function. (Please refer to Table 1 at the end of the article for pre-defined line styles) As an example, let us plot the above input as a dashed line and a dotted line. We will plot our sine function as a dashed line and cos function as a dotted line. Our inputs A, b & c are then passed as arguments to our function. This is how our input and output will look like in MATLAB console:
Code:
A = pi : pi/100 : 3*pi

b = sin (A)

c = cos (A)

figure

plot(A,b,’--’,A,c,’:’)
As we can notice in our input, we have passed the pre-defined line style for ‘b’ and ‘c’ to get dashed and dotted plots respectively.
Output:
Example #4
Next we will learn how to get plots with the color of our choice. For this also, we pass the pre-defined color code as an argument to our pot function. As an example, we will try to obtain the above plot in yellow and magenta color. Let’s have a sine function in yellow color and cosine function in magenta. (Please refer to Table 2 at the end of the article to get pre-defined color codes) This is how our input and output will look like in MATLAB console:
Code:
A = pi : pi/100 : 3*pi

b = sin (A)

c = cos (A)

figure

plot(A,b,'y',A,c,'m')
As we can see in our input, all we did is passed the desired color code in the argument.
Output:
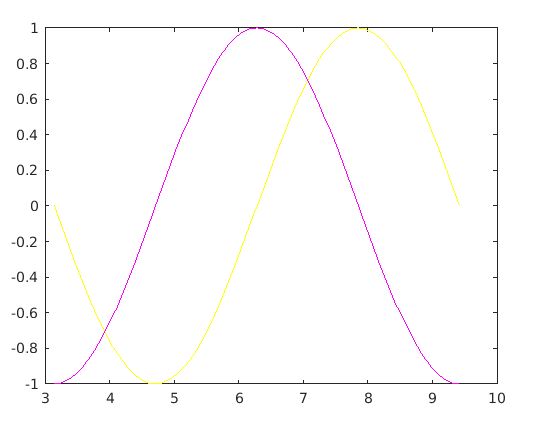
As we can see in the output obtained, sine and cosine functions are obtained in yellow & magenta color respectively, as expected.
Conclusion
We learned how to plot vectors in MATLAB and also how to achieve desired styles. As an extra tip, keep in mind that we can pass both ‘color’ and ‘line style’ as input, if we need a plot which is colored and also of some pattern. Simply pick the desired code from the tables below and pass it as the input, as explained in the article.
Recommended Articles
This is a guide to Plot Vector Matlab. Here we discuss introduction to Plot Vector Matlab, Syntax with explanation, Examples with code and output. You can also go through our other related articles to learn more –
