Updated February 28, 2023

Introduction to Matlab pcolor()
In MATLAB, pcolor() is the plotting function which is designed to represent the input matrix data in the form of an array of colored cells creating a pseudo color plot. The colored cell is termed as face. The plot gets created as x-y plane flat surface with x and y co-ordinates as vertices(corners) of faces. The limits for x and y co-ordinates are decided by the size of the input matrix.
Syntax
There are different syntaxes that can be used to implement pcolor() method based on the input arguments given to it. Such as:
Where C is the input matrix data
pcolor(C)
Where C is the input matrix data
pcolor(X,Y,C)
X– x-coordinates of the vertices
Y- y-coordinates of the vertices
ax defines the axes targeted for the plot
pcolor(ax,___)
To store the pseudo color plot as surface object
s=pcolor(___)
Attributes of Matlab pcolor()
Here is the table of Attributes:
| Attribute | Description |
| C | Input matrix data |
| X,Y | coordinates of the vertices |
| Ax | axes targeted for the plot |
Examples to Implement Matlab pcolor()
Here are the examples mentioned:
Example #1
create pseudo color plot for input matric Cmat.
Code:
Cmat=z=[567;111213];

pcolor(Cmat);
Output:
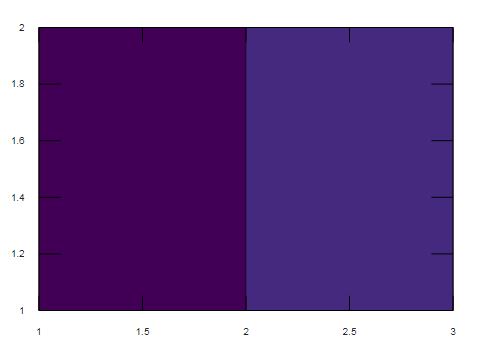
Explanation: The input matrix is of size 2X3 and the vertices of the plot is decided 2X3 as default data. The pseudo color plot also can be created in the reverse direction using axis function.
Example #2
Generate Hadamard square orthogonal matrix and create pseudo color plot for same,with the origin set in the upper left corner.
Code:
CMat = hadamard(40);

pcolor(CMat)

axis ij

axis square
Output:
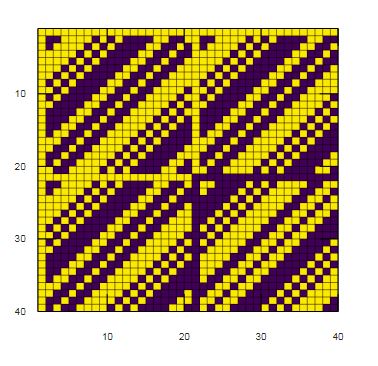
Explanation: The resultant graph is a 40X40 two-color map, represented in the reverse direction.
Example #3
Create pseudo color plot for the input matrix data Cmat within the defined x and y coordinates given by matrix inputs X and Y.
Code:
Xcod=[1 2 4; 1 2 5; 1 2 6];

Ycod = Xcod';

Cmat = [2 4 3; 2 3 5; 6 5 6];

pcolor(Xcod,Ycod,Cmat)
Output:
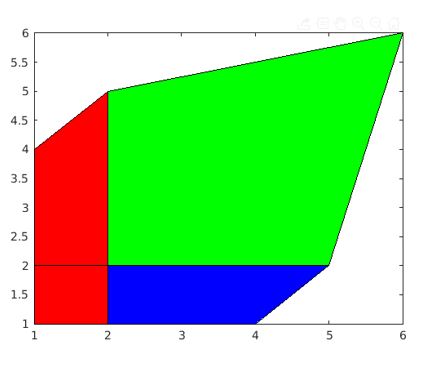
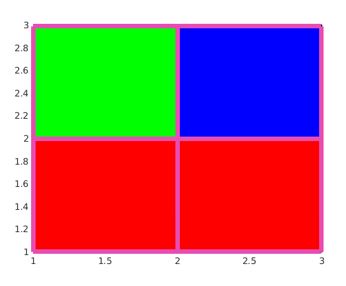
Explanation: The resultant plot has the vertices as per the values given by X and Y matrices and data from Cmat is plotted within the limits. The data from the input matrix are represented by different color code in the plot.
Example #4
MATLAB supports tilling of plots using the functions like nexttile() and tiledlayout(). The below code is wriiten to create 1X2 chart layout and creating two different pseudo color plot for two different set of inputs and functions in each cell of the layout.
Code:
tiledlayout(1,2)

Lx = nexttile;

LCmat = rand(60,15);

pcolor(Lx,LCmat)

Rx = nexttile;

colorscale = [1:20; 20:-1:1];

RCmat = repmat(colorscale,10,1);

pcolor(Rx,RCmat)
Output:
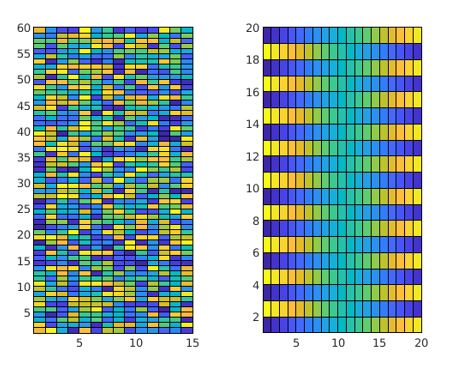
Explantion: The resultant plots are arranged in single layout consisting of two tiles generated using the function nexttile().
Pcolor() with Surface Object
When pcolor() method is assigned to a variable, it returns a surface object. This return value can be used to customize the properties of the plot after its creation.
Example #1
The below code is developed create a pseudo color plot for input matrix and modify the edge color and line width after the plot is generated.
Code:
Cmat = [1 2 3; 4 5 6; 7 8 9];

s = pcolor(Cmat);

s.EdgeColor = [0.9 0.3 0.7];

s.LineWidth = 5;
Output:
Explanation: The resultant pseudo color plot is assigned to variable ‘s’. The edge color and the line width of the plot is modified using ‘s’ value as shown in the output plot.
Example #2
The below code snippet is designed to create the pseudo color plot and modify the face color of the cells using interpolated coloring using surface object properties.
Code:
Cmat = [15 3 9 17 22; 31 12 24 28 14; 16 14 23 24 25];

s = pcolor(Cmat);

s.FaceColor = 'interp';
Output:
Explanation: The resultant pseudo color plot is assigned to surface object ‘s’. The color representation of the faces are modified due to modification applied to the surface object property ‘facecolor’ for the surface object ‘s’.
Semi Logarithm Plotting using pcolor()
The MATLAB plotting function pcolor() can also be used to create semi logarithmic pseudo color plot.
Example #1
The below MATLAB code is designed to create semi logarithmic pseudo color plot and to alter the appearance using surface object properties from its return value.
Code:
[X,Y] = meshgrid(1:20);

YL = log(Y);

colorscale = [1:20; 20: -1:1];

Cmat = repmat(colorscale,10,1);

s = pcolor(X,YL,Cmat);
Output:
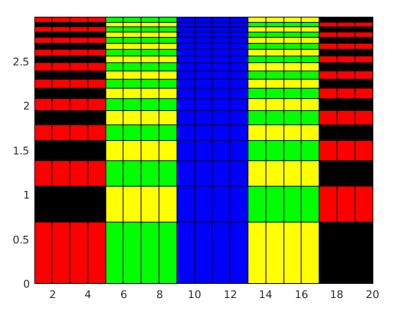
Explanation: The resultant output is surface plot where y-coordinate input is the logarithmic function of x-coordinate inputs. The pseudo color semi logarithmic plot generated from the pcolor() method can be stored as surface object and its properties can be altered as shown in the below example:
Example #2
Code:
[X,Y] = meshgrid(1:20);

YL = log(Y);

colorscale = [1:20; 20:-1:1];

Cmat = repmat(colorscale,10,1);

s = pcolor(X,YL,Cmat);

logvals = YL(2:2:20,1)';

set(gca,'YTick',logvals);
Output:
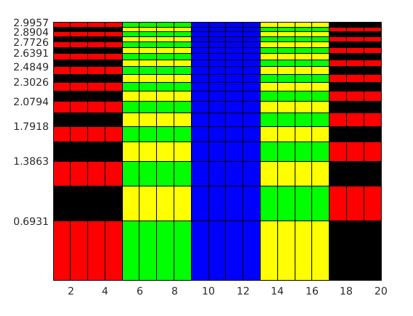
Explanation: The plot from the above code is generated with modified y-tick values by altering the properties of the surface object ‘s’.
Parametric Plotting using pcolor()
Parametric functions are also supported by pcolor() method.
Example #1
The below MATLAB code is designed to generate pseudo color plot from the x-y co oridinates generated from parametric equations.
Code:
[Xcd,Ycd] = meshgrid(-3:6/17:3);

fX = 2*Xcd.*Ycd;

fY = Xcd.^2 + Ycd.^2;

colorscale = [1:18; 18:-1:1];

Cmat = repmat(colorscale,9,1);

pcolor(fX,fY,Cmat);
Output:
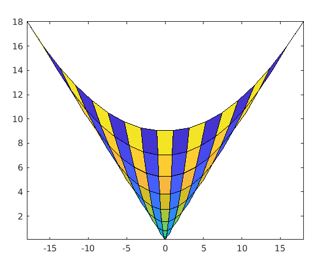
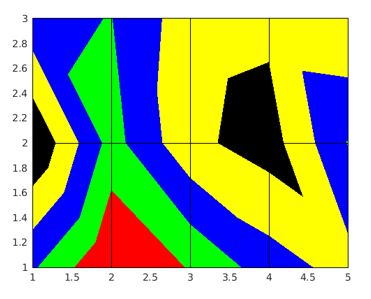
Explanation: The resultant plot represents the input matrix data, generated from repmat() function within the x-y coordinate values that are defined by two parametric equations.
Recommended Articles
This is a guide to Matlab pcolor(). Here we discuss an introduction to Matlab pcolor() with appropriate syntax and respective examples for better understanding. You can also go through our other related articles to learn more –
