EDUCBA

EDUCBA

MENUMENU
  • Free Tutorials
  • Free Courses
  • Certification Courses
  • 360+ Courses All in One Bundle
  • Login
Home Data Science Data Science Tutorials Matlab Tutorial xlabel Matlab
Secondary Sidebar
Matlab Tutorial
  • Functions
    • MATLAB Functions
    • MATLAB user defined function
    • Calling Functions in MATLAB
    • Transfer Functions in MATLAB
    • Anonymous Functions in MATLAB
    • Inline Functions in MATLAB
    • Bessel Functions in MATLAB
    • Mean Function in MATLAB
    • Find Function MATLAB
    • Filter Function in MATLAB
    • IIR Filter MATLAB
    • Piecewise Function in MATLAB
    • Sum Function in MATLAB
    • Simulink MATLAB Function
    • MATLAB Create Function
    • MATLAB Inverse Function
    • MATLAB Count
    • Step Function MATLAB
    • MATLAB limit
    • Fminsearch in MATLAB
    • Covariance in MATLAB
    • Summation in MATLAB
    • Linear Fit MATLAB
    • MATLAB?linear regression
    • MATLAB Derivative
    • MATLAB Derivative of Function
    • MATLAB Comet()
    • Fzero MATLAB
    • xlabel MATLAB
    • Matplotlib Legend
    • Matplotlib Subplots
    • Plot graph MATLAB
    • MATLAB Format
    • MATLAB plot title
    • Multiple Plots in MATLAB
    • MATLAB Indexing
    • Ceil MATLAB
    • Curve Fitting MATLAB
    • MATLAB trapz()
    • MATLAB Normalize
    • MATLAB diff
    • MATLAB sym()
    • MATLAB Syms
    • Absolute Value MATLAB
    • MATLAB Exponential
    • Kalman Filter MATLAB
    • Low Pass Filter MATLAB
    • Bandpass Filter MATLAB
    • MATLAB Unique
    • Trapezoidal Rule MATLAB
    • MATLAB Root Finding
    • MATLAB stem()
    • MATLAB loglog()
    • MATLAB Autocorrelation
    • MATLAB Sort
    • Simplify MATLAB
    • Cumsum MATLAB
    • Eval Function MATLAB
    • Polyval MATLAB
    • MATLAB Colon
    • MATLAB Eigenvalues
    • MATLAB fit
    • Delta Function MATLAB
    • MATLAB Remainder
    • Differentiation in MATLAB
    • Permute MATLAB
    • isempty MATLAB
    • MATLAB text()
    • MATLAB Display Text
    • Varargin in MATLAB
    • MATLAB gca
    • MATLAB fill()
    • MATLAB pcolor()
    • MATLAB min
    • MATLAB xcorr
    • MATLAB? color codes
    • Semilogy MATLAB
    • MATLAB? eye
    • feval MATLAB
    • num2str in MATLAB
    • MATLAB Images
    • MATLAB Image? Segmentation
    • Imagesc MATLAB
    • MATLAB Image Processing
    • MATLAB Image Resize
    • MATLAB Flag
    • MATLAB fopen
    • Strcmp MATLAB
    • MATLAB fwrite
    • MATLAB fft()
    • MATLAB zeros()
    • MATLAB textread
    • Arctan MATLAB
    • MATLAB Scripts
    • Butterworth filter MATLAB
    • MATLAB Findpeaks
    • MATLAB find Index
    • MATLAB Cell
    • MATLAB Unit Step Function
    • MATLAB Backslash
    • MATLAB Mod
    • Size Function in MATLAB
    • Secant MATLAB
  • Basic
    • MATLAB Area Under Curve
    • MATLAB not equal
    • MATLAB max
    • MATLAB exist
    • MATLAB Table
    • MATLAB regression
    • MATLAB Lists
    • MATLAB quantile
    • MATLAB Round
    • MATLAB readtable
    • MATLAB disp
    • MATLAB Standard Deviation
    • MATLAB quadprog
    • MATLAB Transpose
    • Introduction to MATLAB
    • Advantages of MATLAB
    • MATLAB Features
    • Taylor Series MATLAB
    • MATLAB Z Transform
    • fsolve in MATLAB
    • MATLAB QR
    • Career in MATLAB
    • Uses Of MATLAB
    • MATLAB Free
    • How to Install MATLAB
    • How to Use MATLAB?
    • MATLAB Version
    • MATLAB Compiler
    • MATLAB Commands
    • MATLAB Block Comment
    • MATLAB? sprintf
    • MATLAB fprintf
    • Data Types in MATLAB
    • MATLAB Integral
    • MATLAB Double Integral
    • MATLAB boolean
    • MATLAB vpa
    • MATLAB Object
    • MATLAB Annotation
    • MATLAB Variables
    • MATLAB Global Variables
    • MATLAB Operators
    • MATLAB Logical Operators
    • MATLAB nan
    • MATLAB Patch
    • MATLAB AND Operator
    • MATLAB OR Operator
    • Vectors in MATLAB
    • What is Simulink in MATLAB
    • MATLAB Interpolation
    • MATLAB Imread
    • fscanf MATLAB
    • Euler Method MATLAB
    • Root Locus MATLAB
    • MATLAB return
    • Bode Plot MATLAB
    • Nargin MATLAB
    • MATLAB Matrix Inverse
    • MATLAB String to Number
    • MATLAB string
    • MATLAB ColorBar
    • MATLAB Surfc
    • MATLAB Concatenate
    • NUMEL MATLAB
    • MATLAB? File Extension
    • MATLAB File
    • MATLAB Smooth
    • MATLAB ones
    • Exponential in MATLAB
    • MATLAB ksdensity
    • MATLAB log
    • MATLAB Append
    • MATLAB hold on
    • MATLAB Magnitude of Vector
    • Heatmap in MATLAB
    • MATLAB xticks
    • MATLAB randn
  • Control Statements
    • IF-Else Statement in MATLAB
    • If Statement in MATLAB
    • Loops in MATLAB
    • For Loop in MATLAB
    • While Loop in MATLAB
    • do while loop in MATLAB
    • Nested Loop in MATLAB
    • Switch Statement in MATLAB
    • Break in MATLAB
  • Matrix
    • Matrix in MATLAB
    • 3D Matrix in MATLAB
    • Transpose Matrix MATLAB
    • Sparse Matrix in MATLAB
    • Matrix Multiplication in MATLAB
    • Identity Matrix in MATLAB
    • MATLAB?writematrix
  • Advanced
    • MATLAB Class
    • Arrays in MATLAB
    • Matlab find value in array
    • MATLAB Grader
    • Power Spectral Density MATLAB
    • Matlab Textscan
    • String Array in MATLAB
    • MATLAB Random Numbers
    • Matlab Dot
    • MATLAB 2D Array
    • MATLAB? zero padding
    • MATLAB sort matrix
    • MATLAB Plot Function
    • 2D Plots in MATLAB
    • 3D Plots in MATLAB
    • MATLAB Fread
    • Spectrogram MATLAB
    • MATLAB Average
    • MATLAB exponent
    • MATLAB not enough input arguments
    • MATLAB comment
    • MATLAB zpk
    • Scatter Plots in MATLAB
    • MATLAB 3d scatter plot
    • Bar Graph in MATLAB
    • Bar Plot MATLAB
    • Log Plot MATLAB
    • Polar Plot in MATLAB
    • Surface Plot in MATLAB
    • MATLAB Plot Circle
    • Boxplot in MATLAB
    • MATLAB Plot Multiple Lines
    • Linspace MATLAB
    • Histogram in MATLAB
    • Plot Vector MATLAB
    • MATLAB Legend
    • MATLAB Plot Legend
    • MATLAB ezplots
    • Column Vector MATLAB
    • MATLAB Plot Marker
    • MATLAB LineWidth
    • MATLAB Line Style
    • Contour plot in MATLAB
    • MATLAB Sine Wave
    • Reshape in MATLAB
    • Natural Log in MATLAB
    • Random Number Generator in MATLAB
    • Complex Numbers in MATLAB
    • MATLAB Figure
    • Heatmap in MATLAB
    • MATLAB Technical Computing
    • Colors in MATLAB
    • Colormap in MATLAB
    • MATLAB Plot Colors
    • MATLAB fplot()
    • MATLAB Stacked Bar
    • MATLAB sphere()
    • MATLAB cylinder()
    • MATLAB mesh()
    • Pie Chart in MATLAB
    • MATLAB Gradient
    • Grid on MATLAB
    • Repmat in MATLAB
    • dlmread in MATLAB
    • Meshgrid in MATLAB
    • MATLAB Struct
    • MATLAB Cross Product
    • MATLAB colorbar Label
    • MATLAB Save Variable
    • MATLAB Saveas
    • MATLAB Cell Array
    • Polynomial in MATLAB
    • ismember MATLAB
    • Heaviside MATLAB
    • MATLAB rref
    • MATLAB polyfit()
    • MATLAB xlim
    • MATLAB Variance
    • Optimset MATLAB
    • Quiver MATLAB
    • Newton Raphson MATLAB
    • Mat2cell MATLAB
    • Magnitude MATLAB
    • format long MATLAB
    • Dot Product MATLAB
    • Jacobian MATLAB
    • What is Matlab?
    • Convolution MATLAB
    • Moving Average MATLAB
    • Fourier Series MATLAB
    • Gaussian Fit MATLAB
    • Bisection Method MATLAB
    • Laplace Transform MATLAB
    • Fourier Transform MATLAB
    • Signal Processing MATLAB
    • MATLAB Forms
    • Complex Conjugate MATLAB
    • MATLAB Write to File
    • uigetfile MATLAB
    • MATLAB Toolbox
    • MATLAB Errorbar
    • MATLAB Index Exceeds Matrix Dimensions
    • Nyquist MATLAB
    • Impulse Response MATLAB
    • xlsread MATLAB
    • MATLAB xlswrite
    • Matplotlib Scatter
    • MATLAB Import Data
    • MATLAB Export Data
    • MATLAB Read CSV
  • Programs
    • Square Root in MATLAB
    • Square Wave MATLAB
    • Squeeze MATLAB
    • Factorial in MATLAB
    • Cell to String MATLAB
  • Interview Questions
    • MATLAB Interview Questions

Related Courses

MATLAB Certification Course

R Programming Course

All in One Data Science Courses

xlabel Matlab

By Priya PedamkarPriya Pedamkar

xlabel Matlab

Introduction to xlabel Matlab

MATLAB, as we know, is a great tool for visualization. It provides us with ability to create a wide variety of plots. In this article we will focus on how to label x axis according to our requirement. In MATLAB, xlabels function is used to set a custom label for x axis.

Let us start by taking the example of a bar plot depicting salaries of employees.

Syntax

Let A be an array containing salaries of 6 employees Jim, Pam, Toby, Mike, Sam, Steve; in the same order.

Start Your Free Data Science Course

Hadoop, Data Science, Statistics & others

All in One Data Science Bundle(360+ Courses, 50+ projects)
Python TutorialMachine LearningAWSArtificial Intelligence
TableauR ProgrammingPowerBIDeep Learning
Price
View Courses
360+ Online Courses | 50+ projects | 1500+ Hours | Verifiable Certificates | Lifetime Access
4.7 (86,171 ratings)
  • A = [ 20000, 25000, 30000, 42000, 70000, 35000 ][Defining an array of salaries]

Now we will plot a bar graph for the data above. We will pass our names as categorical array:

  • B = categorical ({‘Jim’, ‘Pam’, ‘Toby’, ’ Mike’, ‘Sam’, ‘Steve’ })[Defining an array of employee names]
  • B = reordercats(B, {‘Jim’, ‘Pam’, ‘Toby’, ‘Mike’, ‘Sam’, ‘Steve’})[Calling ‘reordercats’ to preserve the order]
  • bar (B, A)  [Creating the bar pot]

Now, we will name our x-axis as “Employee Salary”. For doing so, we will be using ‘xlabel’ function.

  • xlabel({‘Employee Salary’})[Setting the name of x-axis]
Note: That in above line of code, we have passed ‘Employee Salary’ as an argument to ‘xlabel’

This is how our input and output will look like in MATLAB console:

Code:

A = [ 20000, 25000, 30000, 42000, 70000, 35000 ] B = categorical ({'Jim', 'Pam', 'Toby', 'Mike', 'Sam', 'Steve' })
B = reordercats(B, {'Jim', 'Pam', 'Toby', 'Mike', 'Sam', 'Steve'})
bar (B, A)
xlabel({'Employee Salary'})

Output:

Employee Salary

As we can see, we have named our x axis as ‘Employee Salary’.

How to get the x-axis label in the color of our choice?

In the above output, MATLAB has created x-axis label in black color. Now what if we want it to be in some other color? For our understanding, we will create x-label in green color.

Syntax

  • A = [ 20000, 25000, 30000, 42000, 70000, 35000 ][Defining an array of salaries]

Now we will plot a bar graph for the data above. We will pass our names as categorical array:

  • B = categorical ({‘Jim’, ‘Pam’, ‘Toby’, ’ Mike’, ‘Sam’, ‘Steve’ })[Defining an array of employee names]
  • B = reordercats(B, {‘Jim, ‘Pam, ‘Toby, Mike, ‘Sam’, ‘Steve’})[Calling ‘reordercats’ to preserve the order]
  • bar (B, A) [Creating the bar pot]

Now, we will set the color of label for our x-axis as green. For doing so, we will be passing ‘g’in argument.

  • xlabel(‘Employee Salary’, ‘color’, ‘g’)[Setting the name and color]
Note: That in above line of code, we have passed ‘color’ and ‘g’ as an argument to ‘xlabel’

This is how our input and output will look like in MATLAB console:

Code:

A = [ 20000, 25000, 30000, 42000, 70000, 35000 ] B = categorical ({'Jim', 'Pam', 'Toby', 'Mike', 'Sam', 'Steve' })
B = reordercats(B, {'Jim', 'Pam', 'Toby', 'Mike', 'Sam', 'Steve'})
bar (B, A)
xlabel('Employee Salary', 'color', 'g')

Output:

color of our choice

Note: In the above output that ‘Employee Salary’ is now in green color as expected by us.

How to add value from a variable to our xlabel?

For this example, we will see data of half-yearly sales:

Syntax

  • a = [10.1, 12.1, 14.1, 16.1, 18.1, 20.1][Defining the array with sales in millions ]
  • b = categorical({‘Jan’, ‘Feb’, ‘March’, ‘April’, ‘May’, ‘June’})[Respective months]
  • bar(b, a)
  • year = 2019[Declaring the variable from which we will extract the value]
  • xlabel([‘Sales in millions for half year’,num2str(year)])
Note: In the above code that we passed our variable as an argument 

This is how our input and output will look like in MATLAB console:

Code:

a = [10.1, 12.1, 14.1, 16.1, 18.1, 20.1] b = categorical({'Jan', 'Feb', 'March', 'April', 'May', 'June'})
bar(b, a)
year = 2019
xlabel(['Sales in millions for half year',num2str(year)])

Output:

xlabel Matlab - 3

As we can clearly see n the output, we have obtained the value of the year from our variable.

In the above example we can also create a multiline label; i.e we can have the label ‘Sales in millions for half year’ in one line and ‘2019’ in another line. Let us see how to do it.

Syntax

  • a = [10.1, 12.1, 14.1, 16.1, 18.1, 20.1][Defining the array with sales in millions ]
  • b = categorical({‘Jan’, ‘Feb’, ‘March’, ‘April’, ‘May’, ‘June’})[Respective months]
  • bar(b, a)
  • xlabel({‘Sales in millions for half year’, ‘(2019)’})
Note: In the above code that we have passed an array of characters 

This is how our input and output will look like in MATLAB console:

Code:

a = [10.1, 12.1, 14.1, 16.1, 18.1, 20.1] b = categorical({'Jan', 'Feb', 'March', 'April', 'May', 'June'})
bar(b, a)
xlabel({'Sales in millions for half year','(2019)'})

Output:

xlabel Matlab - 4

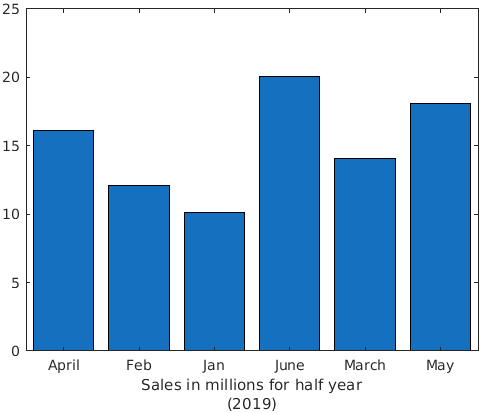
We can see in our output that there are 2 rows of labels now as expected.

Conclusion – xlabel Matlab

MATLAB can be used to plot our data for visualizing and intuitively understanding it. There could be instances when we have to provide a label to our x-axis. In such cases, we make use of the function ‘xlabel’.

Recommended Articles

This is a guide to xlabel Matlab. Here we discuss an introduction, syntax, how to use apply xlabel in Matlab with examples codes and output. You can also go through our other related articles to learn more –

  1. Matlab Plot Circle
  2. Summation in Matlab
  3. Matlab Line Style
  4. Fzero Matlab
Popular Course in this category
MATLAB Training (3 Courses, 1 Project)
  3 Online Courses |  1 Hands-on Project |  8+ Hours |  Verifiable Certificate of Completion
4.5
Price

View Course

Related Courses

R Programming Training (13 Courses, 20+ Projects)4.9
All in One Data Science Bundle (360+ Courses, 50+ projects)4.8
0 Shares
Share
Tweet
Share
Primary Sidebar
Footer
About Us
  • Blog
  • Who is EDUCBA?
  • Sign Up
  • Live Classes
  • Corporate Training
  • Certificate from Top Institutions
  • Contact Us
  • Verifiable Certificate
  • Reviews
  • Terms and Conditions
  • Privacy Policy
  •  
Apps
  • iPhone & iPad
  • Android
Resources
  • Free Courses
  • Database Management
  • Machine Learning
  • All Tutorials
Certification Courses
  • All Courses
  • Data Science Course - All in One Bundle
  • Machine Learning Course
  • Hadoop Certification Training
  • Cloud Computing Training Course
  • R Programming Course
  • AWS Training Course
  • SAS Training Course

ISO 10004:2018 & ISO 9001:2015 Certified

© 2022 - EDUCBA. ALL RIGHTS RESERVED. THE CERTIFICATION NAMES ARE THE TRADEMARKS OF THEIR RESPECTIVE OWNERS.

EDUCBA
Free Data Science Course

SPSS, Data visualization with Python, Matplotlib Library, Seaborn Package

*Please provide your correct email id. Login details for this Free course will be emailed to you

By signing up, you agree to our Terms of Use and Privacy Policy.

EDUCBA Login

Forgot Password?

By signing up, you agree to our Terms of Use and Privacy Policy.

EDUCBA
Free Data Science Course

Hadoop, Data Science, Statistics & others

*Please provide your correct email id. Login details for this Free course will be emailed to you

By signing up, you agree to our Terms of Use and Privacy Policy.

EDUCBA

*Please provide your correct email id. Login details for this Free course will be emailed to you

By signing up, you agree to our Terms of Use and Privacy Policy.

Let’s Get Started

By signing up, you agree to our Terms of Use and Privacy Policy.

This website or its third-party tools use cookies, which are necessary to its functioning and required to achieve the purposes illustrated in the cookie policy. By closing this banner, scrolling this page, clicking a link or continuing to browse otherwise, you agree to our Privacy Policy

Loading . . .
Quiz
Question:

Answer:

Quiz Result
Total QuestionsCorrect AnswersWrong AnswersPercentage

Explore 1000+ varieties of Mock tests View more