Updated March 27, 2023

Introduction to Matlab fill()
In Matlab, fill() function is responsible for creating colored filled polygons from the data indicated by X and Y with vertex color acknowledged by the Colorspec that includes various color specifications. Here, Colorspec is not a type of function or command but gives us three ways to identify color for Matlab graphics to create filled areas or other related functions. It includes types such as RBG triplet, Short name, and Long name. Thus, Fill() in Matlab is used to plot filled polygons where the type of color shading is dependent on the argument list in a matrix and the vertices are recorded along with this data specified by X and Y.
Syntax:
Following is the syntax of fill () function in Matlab:
Fill (X, Y, C)              // It produces filled polygons from the data stated by X and Y with color C.

Fill (X, Y, ColorSpec)          // It is used to fill 2D polygons identified by X and Y with the color specified

Fill (X1, Y1, C1, X2, ….., Xn, Yn, Cn)       // It is used for multiple 2D filled areas in Matlab fill ()

Fill (…, ‘property_name’, property_value)

Fill(ax,..)

h = fill (…..)
Working of Matlab fill()
- In Matlab, the fill (X, Y, C) function creates filled polygons form the statistics in X and Y along with the vertex color that is identified by C. Here, C is recognized as a matrix that helps as an index in the color map. Suppose, if we consider C as a row vector, then length (C) should be equal to size (X, 2) and size (Y, 2). Also, when we consider C as a column vector then, length(c) should be equal to size (X, 1) and size (Y, 1).
- If it is required then fill () function in Matlab can close the polygon by connecting the last vertex with the first one. We can add numeric values or date-time, categorical or durational values in X and Y.
Now, you can use the fill function to create any shaded area as follows:
- Fill (X, Y, ColorSpec) can fill two-dimensional polygons indicated by X and Y with a color identifier that is ColorSpec.
- To define multiple two dimensional filled areas, we can use the following structure of fill () function in X and Y with color vertex C: fill (x1, Y1, C1, X2, Y2, C2, ………, Xn, Yn, Cn) where n is number of terms used as necessary for the matrix or create a fill polygon.
- Also, the fill () function helps to specify any property name and respective values for a particular patch graphics item or object by the following syntax:
Fill (…, ‘property_name’, property_value)
- The fill (ax, …) produces the polygons in the axes stated by ax in place of in the current axes that is gca. In the older syntaxes, the ax option can further precede any of the input argument combinations.
- We need to know that in Matlab, h = fill (…) allows providing a vector of patch objects.
Examples of Matlab fill()
Given below are the examples of Matlab fill():
Example #1
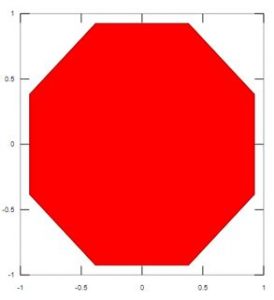
- To create an octagon filled with red color in Matlab using fill () function.
Firstly, declare the data and objects. Then using the fill function generating the filled area of the octagon as follows:
Code:
a = (1 / 16:1 / 8:1) ‘* 2 * pi;

x = cos (a);

y = sin(a);

fill (x, y, ‘r’)

axis square
Output:
Example #2
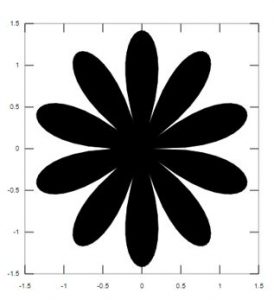
Polygon of like flower design with the below code.
Code:
r = linspace (0, 2*pi, 200);

t = sqrt (abs(2*sin(5*r)));

x = t.*(cos(r));

y = t.*(sin(r));

fill (x, y, ‘k’)

axis (‘square’)
Output:
Some Guidelines to keep in Mind
- Suppose if X and Y are numeric data in a matrix, and another one is a column vector with an equal number of elements as rows in the matrix, then you need to fill in the duplicates of the column vector argument so that it produces a matrix of the required size.
- Here the fill function makes a vertex from matching elements in X and Y thus, creating a polygon from the data in every column.
- Also, if NaN values exist in X or Y, then the polygon is not filled by the fill () function.
- Here, when you give color using ColorSpec, then the fill () function produces a flat-shaded type of polygons by stating the patch object’s property ‘FaceColor’ to the equivalent RGB triplet.
- But, if you agree to use color by C, then the fill function balances the elements of C with the values identified by the axes property i.e. CLim after this the colormap is indexed by C.
- The fill function produces flat-shaded polygons if C is a row vector where the color of the polygon is determined by each element which is defined by the respective column of matrices X and Y. The property of each patch object ‘FaceColor’ is fixed to ‘flat’. The CData property value is defined by each row element for the nth patch object, where n represents the corresponding column in X and Y.
- Suppose if C is stated to be a column vector or a matrix, the fill produces polygons with interpolation colors using linear interpolation of the vertex colors. Here the FaceColor property of patch graphics object is set to ‘interp’ CData property value is defined by the elements present in one column for the respective object.
- To create a desired sized matrix, where C is a column vector then the fill function repeats the column vector.
Conclusion
Remember if you want to get the type of color shading you want then it depends upon the arguments where you pass the color to specify it. In this article, we have learned how we can fill the polygon from the data and vertex index to perform the graphical representation of data in Matlab using fill () function.
Recommended Articles
This has been a guide to Matlab fill(). Here we discuss the introduction, examples, and Working of Matlab fill() along with some guidelines. You may also have a look at the following articles to learn more –
