Updated July 1, 2023
Introduction to Matlab gca
MATLAB’s ‘gca’ method can be used to get the handle for our current axis. Also, if we don’t have any handle, then the ‘gca’ method will generate one. To refresh our understanding of handle, please remember that handle is a number that refers to an Object. This Object can be a figure, axes, or lines. If we need to perform any changes to the Object, we will require a reference to the object, which can be done using the handle.
Syntax:
ca = gca returns the handle to the current axes in the figure.
Let us now understand how to get the current axes in MATLAB using ‘gca’ method.
Examples
Let us discuss examples of Matlab gca.
Example #1
In this example, we will use gca method to get the current axes of our figure. We will plot an exponential function for our first example. The steps to be followed for this example are:
- Initialize the function whose current axes are required
- Use the plot method to display the figure
- Initialize the gca method
- Set the font size for the current axes
- Set the current axes’ limit for the current axes
Code:
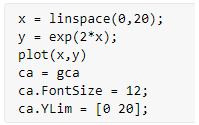
x = linspace (0, 20);

y = exp (2 * x);
[Initializing the x & y axis. Here we are using an exponential function]
plot (x, y)
[Using the plot method to display the figure]
ca = gca
[Using the ‘gca’ method for referring to current axes]
ca.FontSize = 12;
[Setting the font size for the current axes]
ca.YLim = [0 20];
[Setting the current axes’ limit]
This is how our input and output will look in MATLAB command window:
Input:
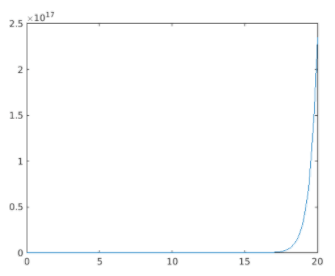
Output 1:
Plot of the exponential function
Output 2:
Getting the current axes of the above figure
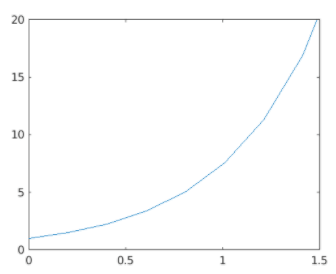
As we can see in the OUTPUT, we have obtained the current axes of the exponential function defined by us.
Example #2
In this example, we will use gca method to get the current axes of our figure. We will plot a sine wave for this example. The steps to be followed for this example are:
- Initialize the function whose current axes are required
- Use the plot method to display the figure
- Initialize the gca method
- Set the font size for the current axes
- Set the current axes’ limit for the current axes
Code:
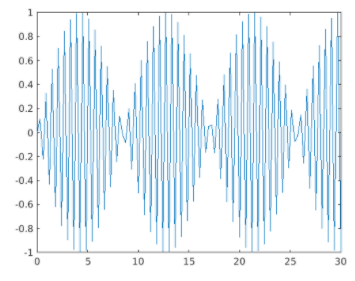
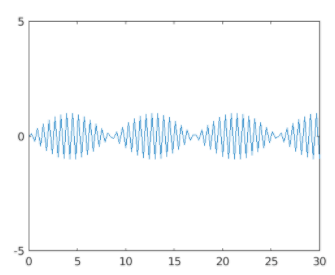
x = linspace (0, 30);

y = sin (10 * x);
[Initializing the x & y axis. Here we are defining a sine wave]
plot (x, y)
[Using the plot method to display the figure]
ca = gca
[Using the ‘gca’ method for referring to current axes]
ca.FontSize = 12;
[Setting the font size for the current axes]
ca.YLim = [-5 5];
[Setting the current axes’ limit for the current axes]
This is how our input and output will look in MATLAB command window:
Input:

Output 1:
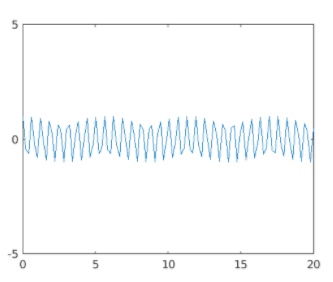
Plot of the sine wave
Output 2:
Getting the current axes of the above figure
As we can see in the OUTPUT, we have obtained the current axes of the sine wave defined by us.
Example #3
In this example, we will use gca method to get the current axes of our figure. We will plot a cos wave for this example. The steps to be followed for this example are:
- Initialize the function whose current axes are required
- Use the plot method to display the figure
- Initialize the gca method
- Set the font size for the current axes
- Set the current axes’ limit for the current axes
Code:
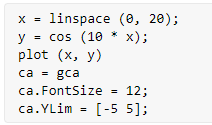
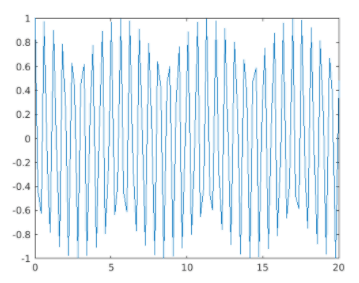
x = linspace (0, 20);

y = cos (10 * x);
[Initializing the x & y axis. Here we are defining a cos wave]
plot (x, y)
[Using the plot method to display the figure]
ca = gca
[Using the ‘gca’ method for referring to current axes]
ca.FontSize = 12;
[Setting the font size for the current axes]
ca.YLim = [-5 5];
[Setting the current axes’ limit for the current axes]
This is how our input and output will look in Matlab command window:
Input:
Output 1:
Plot of the cos wave
Output 2:
Getting the current axes of the above figure
As we can see in the OUTPUT, we have obtained the current axes of the cos wave defined by us.
Example #4
In this example, we will use gca method to get the current axes of our figure. We will plot a logarithmic function for this example. The steps to be followed for this example are:
- Initialize the function whose current axes is required
- Use the plot method to display the figure
- Initialize the gca method
- Set the font size for the current axes
- Set the current axes’ limit for the current axes
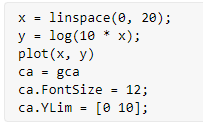
Code:
x = linspace (0, 20);

y = log (10 * x);
[Initializing the x & y axis. Here we are defining a logarithmic function]
plot (x, y)
[Using the plot method to display the figure]
ca = gca
[Using the ‘gca’ method for referring to current axes]
ca.FontSize = 12;
[Setting the font size for the current axes]
ca.YLim = [0 10];
[Setting the current axes’ limit for the current axes]
This is how our input and output will look in MATLAB command window:
Input:
Output 1:
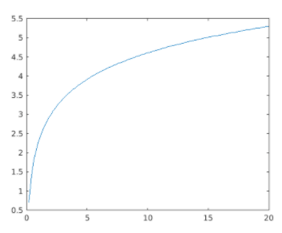
Plot of the logarithm function
Output 2:
Getting the current axes of the above figure
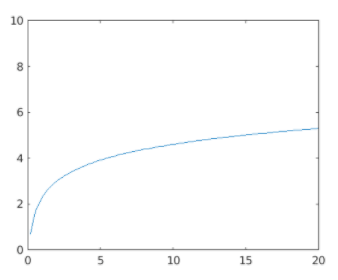
As we can see in the OUTPUT, we have obtained the current axes of the logarithm function defined by us.
Conclusion
In MATLAB, the gca method is used to get the handle for our current axis. If there is no handle, then the ‘gca’ method will generate one.
Recommended Articles
This is a guide to Matlab gca. Here we discuss the introduction, syntax, and steps with output with examples for better understanding. You may also have a look at the following articles to learn more –
