Updated March 20, 2023
Introduction to Functions in R
Functions in R is a routine in R that is purposefully designed and can be implemented as a set of statements that perform a particular task by taking certain parameters, which are also known as an argument passed by the user to obtain a requisite result. In which the user can use as needed based on the context, thus enabling the user to systematically implement the program by dividing it into various parts by writing the code in an understandable manner.
How to write Functions in R?
To write the function in R, here is the syntax:
Fun_name <- function (argument) {

Function body

}
Here, one can see “function” specific reserved word is used in R to define any function. The function takes input which is in the form of arguments. The function body is a set of logical statements performed over arguments, then returns the output. “Fun_name” is the function’s name, which can be called anywhere in the R program.
Let’s see an example, which will be more lucid in understanding the concept.
Code:
Multi <- function(x, y) {

# function to print x multiply y

result <- x*y

print(paste(x,"Multiply", y, "is", result))

}
Output:
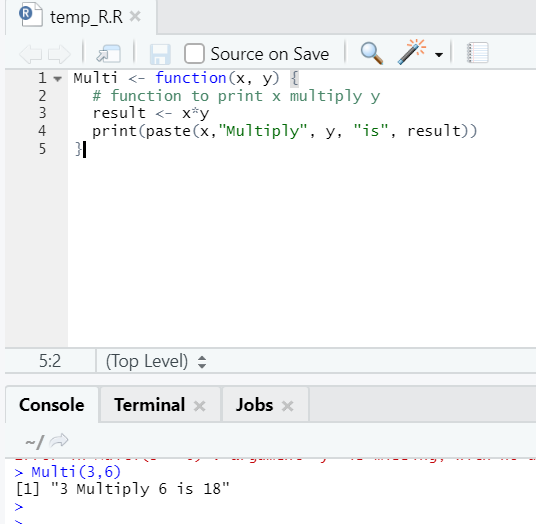
Here we created the function name “Multi”, which takes two arguments as inputs and provides the multiplied output. The first argument is x, and the second argument is y. As you can see, we have called the function by the name “Multi”. Here if someone wants, arguments can also be set to the default value.
Creating Our Own Functions
Here is the format for writing our own function:
Funtion_name <- function(p)

{

Body

return ()

}
Here I am explaining each component of this user-defined function.
1. Function_name
We can give any name to our function, but we decide the function name based on the
Functionality, i.e., the type of operation it performing.
For example, if we are creating a function to calculate the sum of 2 numbers, then.
It’s better to give the name “Sum “ to that function.
2. Body of the Function
We write the steps to perform certain operations; these steps are termed as the body of the function. The code of the function is closed under curly braces {}.
For Example
Suppose we have to calculate the sum of two numbers:
Then the body of the function will be :
Sum (x,y)

{

a=x

b=y

c = a+b

return (c)

}
The highlighted lines are termed as the body of the function.
Now, we have come across a few new terms like return (), and after the name of the function, we have passed two values x, y; these are termed as parameters. I will be explaining these terms in detail:
First, Parameters: These are the variables on which we perform the operation defined in the Function.
Second, return (): Inside the function, we have a return (), which causes our function to exit and hand back value to its caller.
Different Types of Functions in R
Different R functions with Syntax and examples (Built-in, Math, statistical, etc.)
1. Built-in Function
These are the functions that come with R to address a specific task by taking an argument as input and giving an output based on the given input. Let’s discuss some important general functions of R here:
a. Sort
Data can be of the sort of ascending or descending order. Data can be whether a vector of a continuous variable or factor variable.
Syntax:
![]()
Here is the explanation of its parameters:
- x: This is a vector of the continuous variable or factor variable
- decreasing: This can be set either True/False to control order by ascending or descending. By default, it’s FALSE`.
- last: If the vector has NA values, should it be put last or not
R code and output:
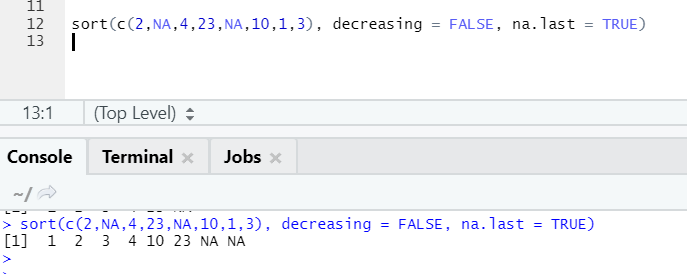
Here one can notice how “NA” values get aligned at the end. As our parameter na.last = True was true.
b. Seq
It generates a sequence of the number between two specified numbers.
Syntax
![]()
Here is the explanation of its parameters:
- from to the start and end value of the sequence.
- Increment/gap between two consecutive numbers in sequence
- length.out the required length of the sequence.
- Along.with: Refers to the length from the length of this argument
R code and output:
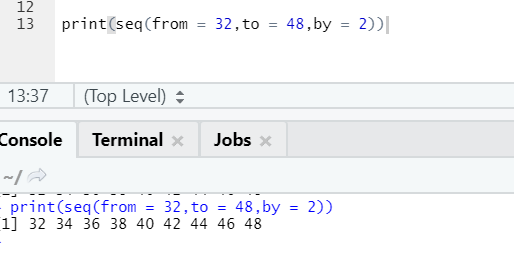
Here one can notice the sequence generated is having an incrementation of 2 because by is defined as 2.
c. Toupper, tolower
The two functions: toupper and tolower, are functions applied on the string to change the cases of the letters in sentences.
R code and output:

One can notice how the cases of letters get changed when applied to the function.
d. Rnorm
This is a built-in function that generates random numbers.
R code and output:
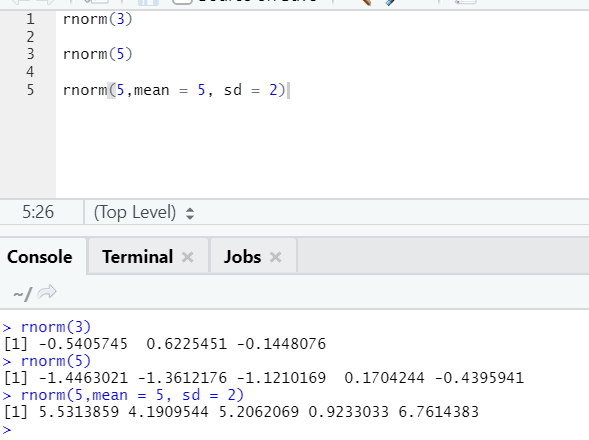
The function rnorm takes the first argument, which says how many numbers need to be generated.
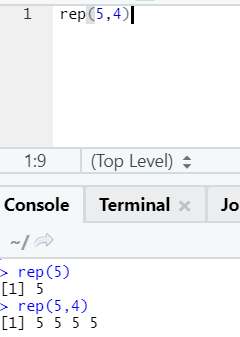
e. Rep
This function replicates the value as many times as specified.
R syntax: rnorm(x,n)
Here x represents the value to replicate, and n represents the number of times it has to be replicated.
R code and output:
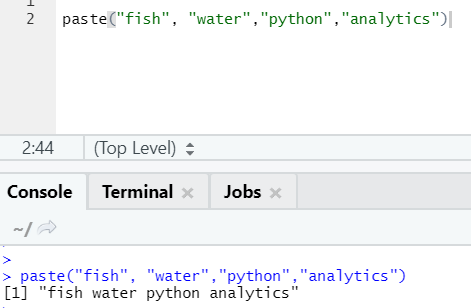
f. Paste
This function is to concatenate strings together with some specific character in between.
syntax
paste(x,sep = “”, collapse = NULL)
R code
paste("fish", "water", sep=" - ")
R output:
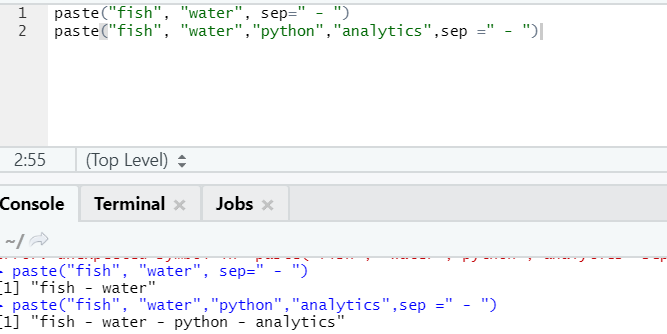
As you can see, we can also paste more than two strings. Sep is that specific character that we added in between strings. By default, sep is space.
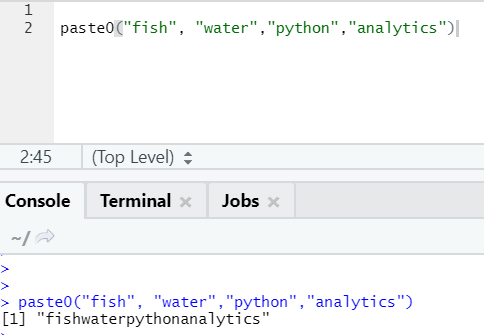
One more similar function exists like this, which everyone should be aware of is paste0.
The function paste0(x,y,collapse) works similar to paste(x,y,sep = “”,collapse)
Please see the example below:
In simple words, to summarize paste and paste0:
Paste0 is faster than paste when it comes to the concatenation of strings without any separator. As paste always looks for “sep” and which is space by default in it.
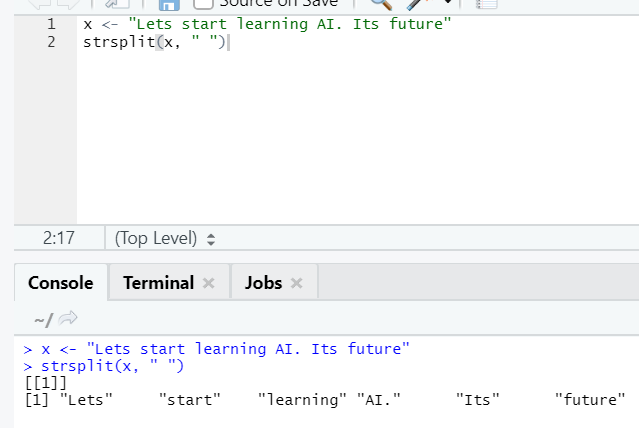
g. Strsplit
This function is to split the string. Let’s see the simple cases:
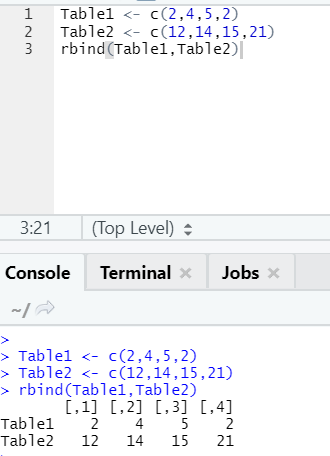
h. Rbind
The function rbind helps in combing vectors with the same number of columns, one over the other.
Example
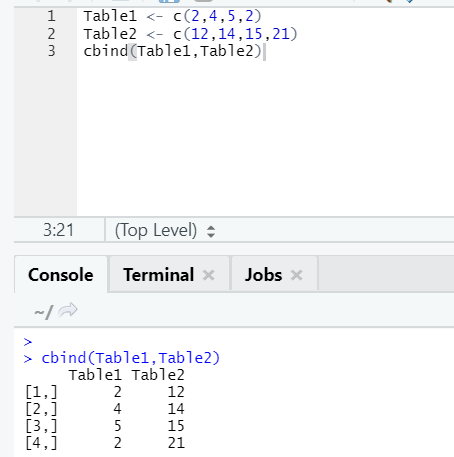
i. cbind
This combines vectors with the same number of rows, side by side.
Example
In case the number of rows doesn’t match, below is the error you will find:
![]()
Both cbind and rbind help in data manipulation and reshaping.
2. Math Function
R provides a wide variety of Math functions. Let’s see a few of them in detail:
a. Sqrt
This function computes the square root of a number or numeric vector.
R code and output:
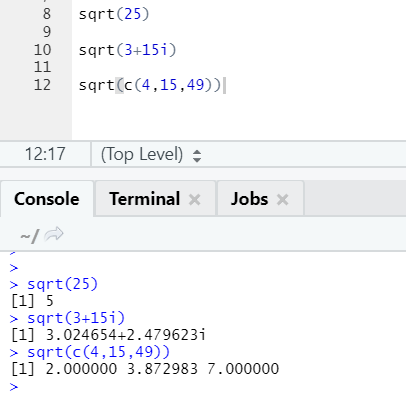
One can see how to square the root of a number, complex number, and a sequence of numeric vectors has been calculated.
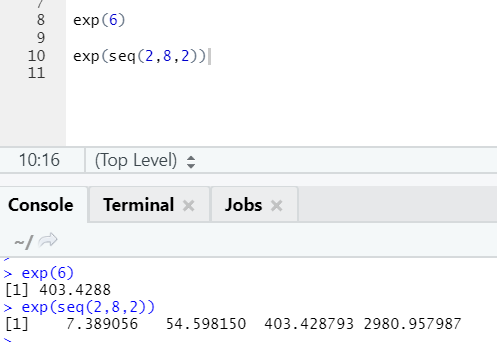
b. Exp
This function calculates the exponential value of a number or a numeric vector.
R code and output:
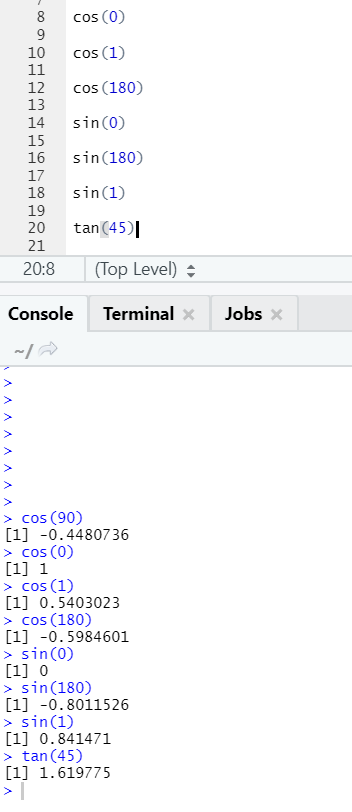
c. Cos, Sin, Tan
These are trigonometry functions implemented in R here.
R code and output:
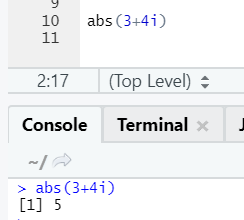
d. Abs
This function returns the absolute positive value of a number.
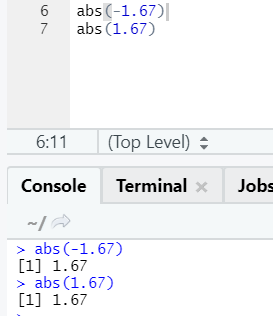
The negative or positive of a number will be returned in its absolute form, as you can see. Let’s see it for a complex number:
e. Log
This is to find the logarithm of a number.
Here is the example shown below:
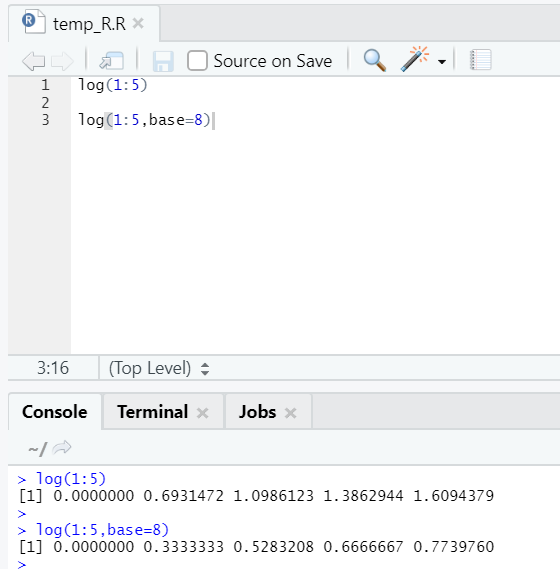
Here one gets the flexibility to change the base, as per requirement.
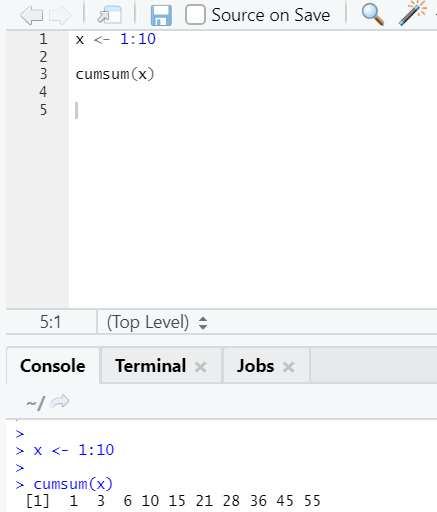
f. Cumsum
This is a mathematical function that gives cumulative sums. Here is the example below:
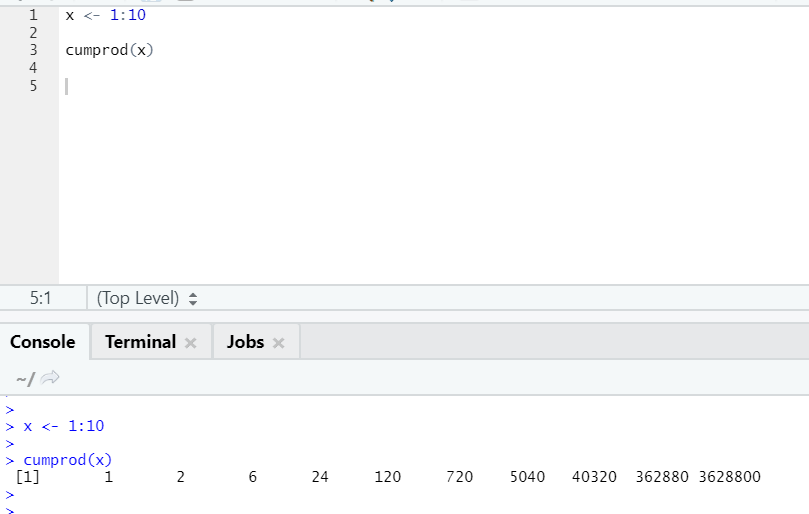
g. Cumprod
Like Cumsum mathematical function, we have cumprod where cumulative multiplication happens.
Please see the example below:
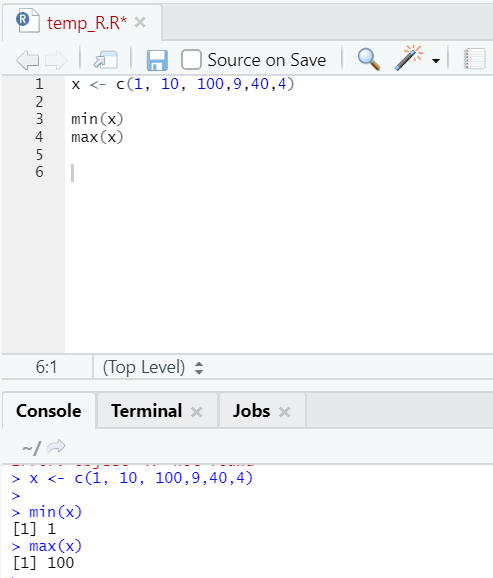
h. Max, Min
This will help you find the maximum/minimum value in the set of numbers. See below the examples related to this:
i. Ceiling
The ceiling is a mathematical function that returns the smallest of integer higher than specified.
Let looks at an example:
ceiling(2.67)
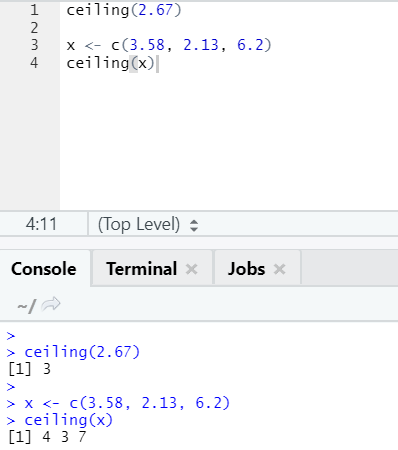
As you can notice, the ceiling is applied over a number as well as over a list, and the output came is the smallest of the next higher integer.
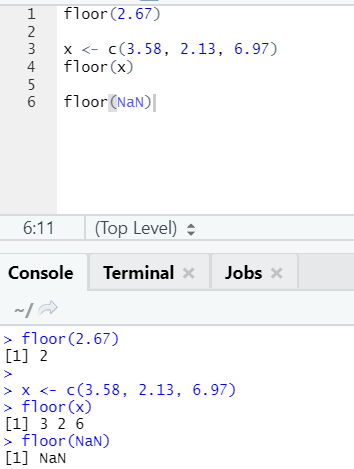
j. Floor
The floor is a mathematical function that returns the least value integer of the number specified.
The example shown below will help you understand it better:
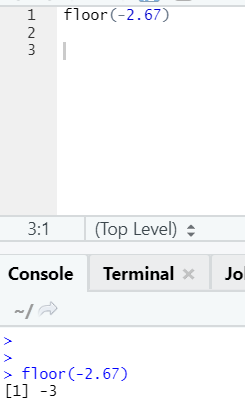
It works the same way for negative values as well. Please take a look:
3. Statistical Functions
These are the functions that describe the related probability distribution.
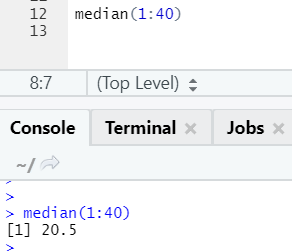
a. Median
This calculated the median from the sequence of numbers.
Syntax
![]()
R code and output:
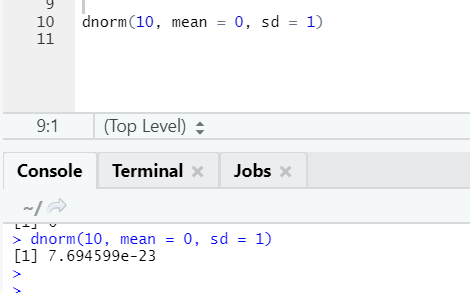
b. Dnorm
This refers to the normal distribution. The function dnorm returns the value of the probability density function for the normal distribution given parameters for x, μ, and σ.
R code and output:
c. Cov
Covariance tells if two vectors are positively, negatively, or totally non-related.
R code
x_new = c(1., 5.5, 7.8, 4.2, -2.7, -5.5, 8.9)

y_new = c(0.1, 2.0, 0.8, -4.2, 2.7, -9.4, -1.9)

cov(x_new,y_new)
R output:
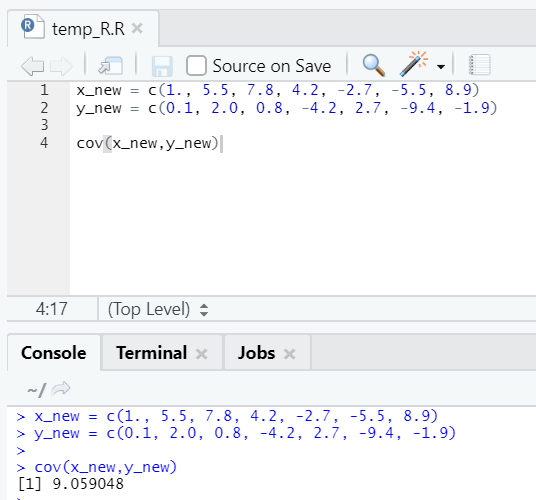
As you can see, two vectors are positively related, which means both vectors move in the same direction. If the covariance is negative, x and y are inversely related and hence move in the opposite direction.
d. Cor
This is a function to find the correlation between vectors. It actually gives the association factor between the two vectors, which is known as the “correlation coefficient”. Correlation adds a degree factor over covariance. If two vectors are positively correlated, the correlation will also tell you to how much extend they are positively related.
These three types of methods can be used to find a correlation between two vectors:
- Pearson correlation
- Kendall correlation
- Spearman correlation
In simple R format, it looks like:
cor(x, y, method = c("pearson", "kendall", "spearman"))
Here x and y are vectors.
Let’s see the practical example of correlation over an inbuilt dataset.
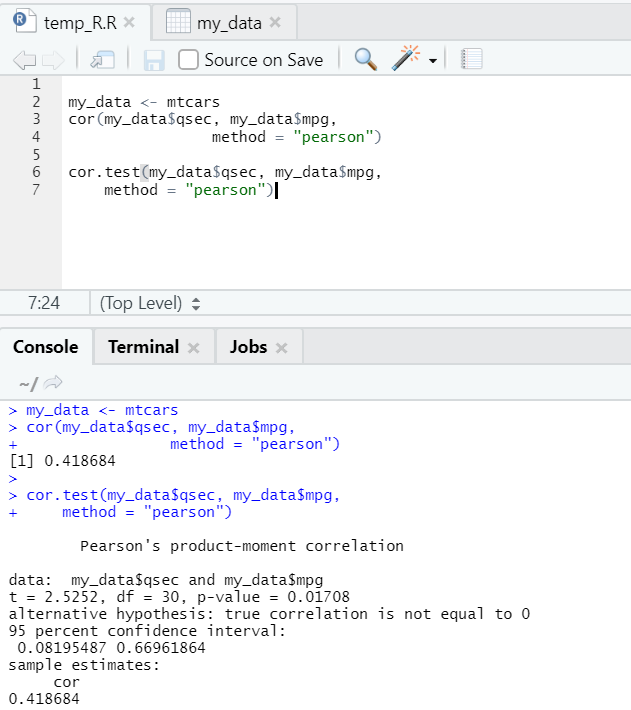
So, here you can see the “cor()” function gave the correlation coefficient 0.41 between “qsec” and “mpg”. However, one more function has also been showcased, i.e. “cor.test()”, which tells the correlation coefficient and the p-value and t value related to it. Interpretation becomes far easier with the cor.test function.
Similar can be done with the other methods of correlation:
R code for the Pearson method:
my_data <- mtcars

cor(my_data$qsec, my_data$mpg, method = " pearson ")

cor.test(my_data$qsec, my_data$mpg, method = " pearson")
R code for Kendall method:
my_data <- mtcars

cor(my_data$qsec, my_data$mpg, method = " kendall")

cor.test(my_data$qsec, my_data$mpg, method = " kendall")
R code for Spearman method:
my_data <- mtcars

cor(my_data$qsec, my_data$mpg, method = "spearman")

cor.test(my_data$qsec, my_data$mpg, method = "spearman")
The correlation coefficient ranges between -1 and 1.
If the Correlation coefficient is negative, that implies when x increases, y decreases.
If the Correlation coefficient is zero, that implies there exists no association between x and y.
If the Correlation coefficient is positive, that implies when x increases, y also tends to increase.
e. T-test
The T-test will tell you if two data sets are coming from the same (assuming) normal distributions or not.
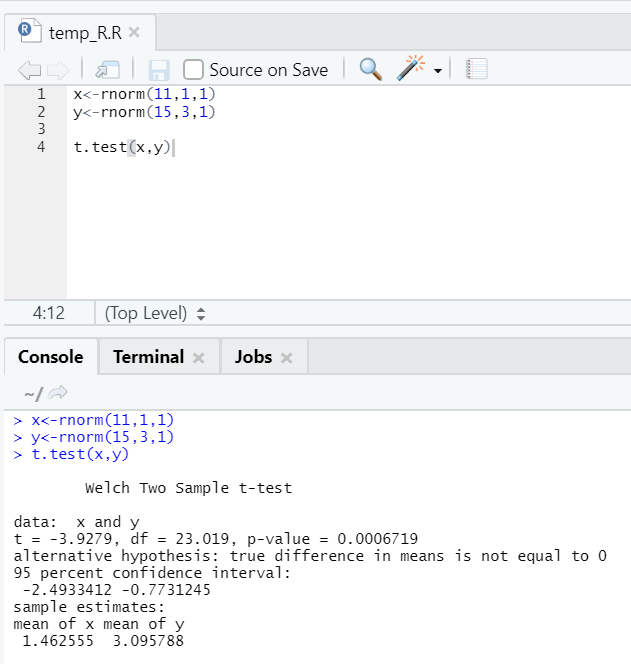
Here you should reject the null hypothesis that the two means are equal because the p-value is less than 0.05.
This shown instance is of type: unpaired data sets with unequal variances. Similarly, it can be tried with the paired dataset.
f. Simple Linear Regression
This shows the relationship between the predictor/independent and response/dependent variable.
A simple, practical example could be predicting the weight of a person if the height is known.
R syntax
lm(formula,data)
Here formula depicts the relation between output, i.e. y and input variable, i.e. x. Data represent the dataset on which the formula needs to be applied.
Let’s see one practical example, where the floor area is the input variable and rent is the output variable.
x <- c(1510, 1000, 600, 500, 1280, 136, 1790, 1630)
y <- c(15000, 10000, 6000, 5000, 12800, 13600,17900, 16300)
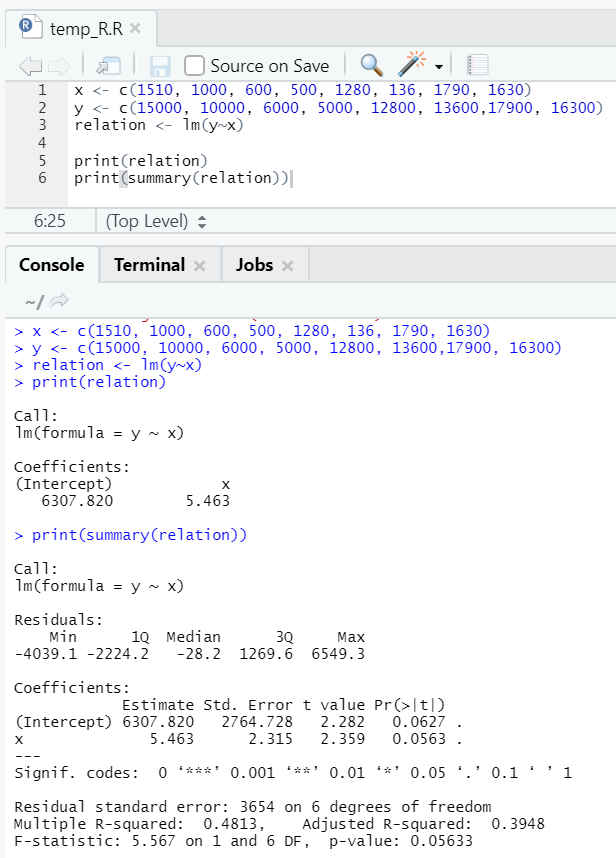
Here P-value is not less than 5%. Hence the null hypothesis cannot be rejected. There is not much significance to prove the relationship between the floor area and rent.
Here R-square value is 0.4813. That implies only 48% of the variance in the output variable can be explained by the input variable.
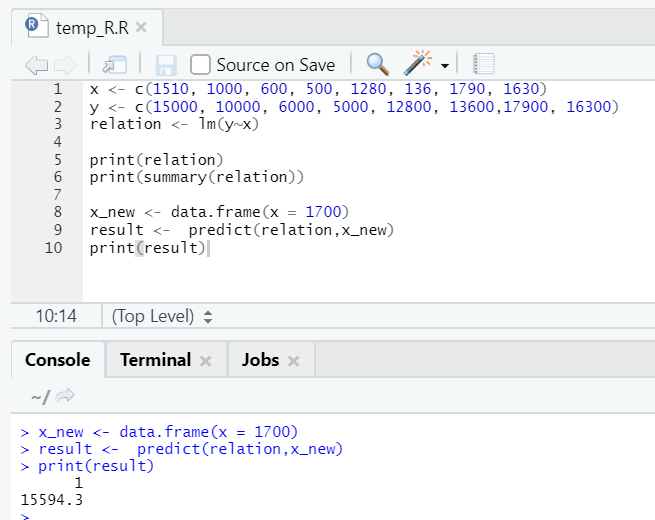
Let’s say now we need to predict for a value of floor area, based on the above-fitted model.
R code
x_new <- data.frame(x = 1700)

result <- predict(relation,x_new)

print(result)
R output:
After the execution of the above R code, the output will look like the following:
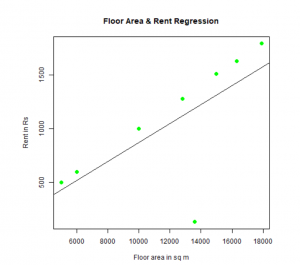
One can fit and visualize regression. Here is the R code for that:
# Give the png chart file a name.
png(file = "LinearRegressionSample.png")
# Plot the chart.
plot(y,x,col = "green",main = "Floor Area & Rent Regression",

abline(lm(x~y)),cex = 1.3,pch = 16,xlab = "Floor area in sq m",ylab = "Rent in Rs")
# Save the file.
dev.off()
This “LinearRegressionSample.png” graph will be generated in your present working directory.
g. Chi-Square test
This is a statistical function in R. This test holds its significance in order to prove if the correlation exists between two categorical variables.
This test also works like any other statistical tests were based on a p-value; one can accept or reject the null hypothesis.
R syntax
chisq.test(data),/code>
Let’s see one practical example of it.
R code
# Load the library.
library(datasets)

data(iris)
# Create a data frame from the main data set.
iris.data <- data.frame(iris$Sepal.Length, iris$Sepal.Width)
# Create a table with the needed variables.
iris.data = table(iris$Sepal.Length, iris$Sepal.Width)

print(iris.data)
# Perform the Chi-Square test.
print(chisq.test(iris.data))
R output:
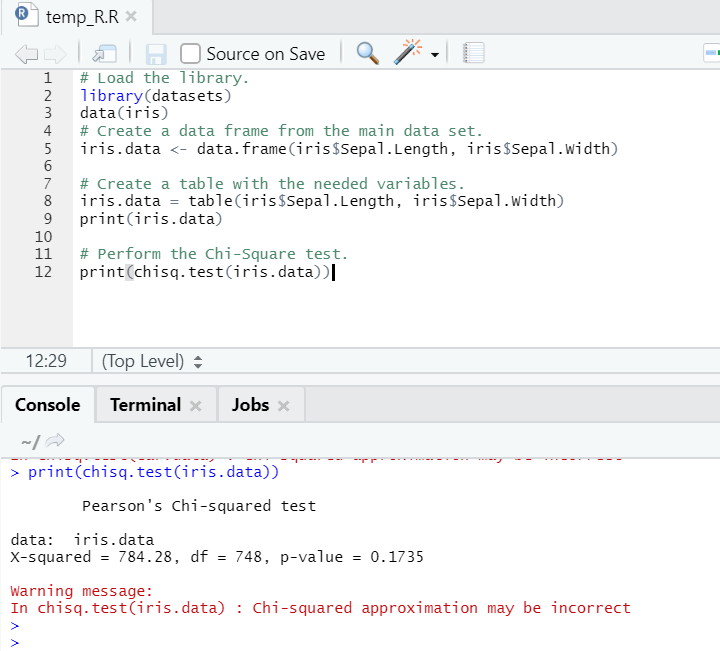
As one can see, the chi-square test has been performed over an iris dataset, considering its two variables, “Sepal. Length” and “Sepal.Width”.
The p-value is not less than 0.05; hence correlation doesn’t exist between these two variables. Or we can say these two variables are not dependent on each other.
Importance to Build the Function
It is very difficult to understand the big chunk of code. It is necessary to devise a new way to break the big monolithic code in smaller readable code, i.e., (Function)
Due to the use of Function, It became a better way to modularize. The function is just another way to group the execution line of codes in one chunk and name it. The name helps us to call it the way you can call me if you know my name.
As we have seen, there are several inbuilt functions in R, which make our
Work easier; we just have to import the libraries and can use the functions
available in these libraries.
Conclusion
They are simple, easy to fit, easy to grasp, and yet very powerful. We saw a variety of functions that are used as part of basics in R. Once one gets comfortable with these functions discussed above, one can explore other varieties of functions. Functions help you make your code run in a simple and concise manner. Functions can be inbuilt or user-defined; all depends on the need while addressing a problem. Functions give a good shape to a program.
Recommended Articles
This is a guide to Functions in R. Here, we discuss how to write Functions in R and different types of Functions in R with syntax and examples. You may also look at the following article to learn more –
