Updated March 24, 2023

Introduction to Predict function in R
A function in R programming which is syntactically represented as predict(model, data) that is used to apply an already obtained model to another section of the dataset over the portion of which the model used in it was trained, with the data over which the model was built being referred to as train dataset and the data over which the model is to be applied referred to as test dataset, is referred to as predict() function in R programming
Predictive Analytics (Machine Learning)
It covers every time frame, basically, it will consider historical data as well as current data and on the basis of it frame a model which will predict the data or you can say forecast the data. It will include statistical techniques, predictive modeling, machine learning, etc.
For Example, in this, we will continue the same scenario which we used in descriptive analytics, like once we fit in the historical or current data into our model and we pass on the predict command on our new input data, automatically model will tell us that which of the new customer has a chance to default on loans. This technique gives the company a good heads up that in which direction they have to work.
Descriptive Analytics (Business Intelligence)
In this branch of analytics, we will interpret the historical data to understand the changes that occurred in the business. The main types of descriptive analytics techniques include data aggregation and data mining which can provide us the knowledge about past events. The best example of this is let’s suppose you are studying the data of the people who took a loan and you want to specifically study which type of people default on loans. By studying closely, we can identify which kind of people default on loans like what is their age or whether they belong to the same location or whether they are into the same occupation or they work under the same industry sector. This will help us to learn from historical mistakes.
Prescriptive Analytics (Decision Science)
It is the combination of both descriptive and predictive analytics, it will help the company to make effective decisions. It can provide an answer to a question like which type of customer will default on the loan, and at the same time suggest the ways like what should a company do to reduce the number of defaults.
In this blog, we will talk about predictive analytics more where we will develop data science models which will help us to predict “what next”. In prediction, there are different types of already existing models in Rstudio like lm, glm or random forest. We will talk about “lm” here.
Predict function syntax in R looks like this:
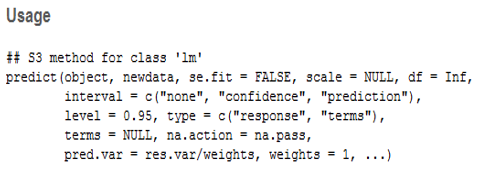
Arguments
- The object is a class inheriting from “lm”
- Newdata is a new data frame wherein we have to predict the value
- Se.fit is used when standard errors are required
- The scale is generally NULL, but it is used for standard error calculation
- Df is degrees of freedom
- Interval, here we have mentioned the type of interval for the calculation
- Level, here we have to mention the confidence level which is fine to the researcher. Like some studies are conducted with 95% confidence and some are done on 99%.
- Type, basically the type of prediction (response or model)
- Na.action is a function which instructs what to do with missing values, the default here is NA
- Pred.var is the variance for future observation which needs to be assumed for the prediction interval
- Weights are the variance weights for prediction
We will work on the dataset which already exists in R known as “Cars”. And we will build a linear regression model that will predict the distance on the basis of the speed.
This dataset has 50 observations of 2 variables.
- The first variable is speed (mph) which has numeric figures
- The second variable is Distance (ft) which also has numeric figures
A dataset “cars” look like this.
| Case Number | Speed | Distance |
| 1 | 4 | 2 |
| 2 | 4 | 10 |
| 3 | 7 | 4 |
| 4 | 7 | 22 |
| 5 | 8 | 16 |
| 6 | 9 | 10 |
| 7 | 10 | 18 |
| 8 | 10 | 26 |
| 9 | 10 | 34 |
| 10 | 11 | 17 |
| 11 | 11 | 28 |
| 12 | 12 | 14 |
| 13 | 12 | 20 |
| 14 | 12 | 24 |
| 15 | 12 | 28 |
| 16 | 13 | 26 |
| 17 | 13 | 34 |
| 18 | 13 | 34 |
| 19 | 13 | 46 |
| 20 | 14 | 26 |
| 21 | 14 | 36 |
| 22 | 14 | 60 |
| 23 | 14 | 80 |
| 24 | 15 | 20 |
| 25 | 15 | 26 |
| 26 | 15 | 54 |
| 27 | 16 | 32 |
| 28 | 16 | 40 |
| 29 | 17 | 32 |
| 30 | 17 | 40 |
| 31 | 17 | 50 |
| 32 | 18 | 42 |
| 33 | 18 | 56 |
| 34 | 18 | 76 |
| 35 | 18 | 84 |
| 36 | 19 | 36 |
| 37 | 19 | 46 |
| 38 | 19 | 68 |
| 39 | 20 | 32 |
| 40 | 20 | 48 |
| 41 | 20 | 52 |
| 42 | 20 | 56 |
| 43 | 20 | 64 |
| 44 | 22 | 66 |
| 45 | 23 | 54 |
| 46 | 24 | 70 |
| 47 | 24 | 92 |
| 48 | 24 | 93 |
| 49 | 24 | 120 |
| 50 | 25 | 85 |
Now we will build the linear regression model because to predict something we need a model that has both input and output. Once the model learns that how data works, it will also try to provide predicted figures based on the input supplied, we will come to the prediction part in a while, first, we will make a model.
linear_model = lm(dist~speed, data = cars)

linear_model
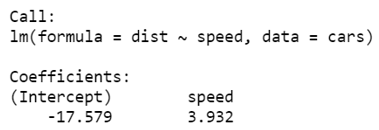
The Linear regression model equation is:
Y = β1 + β2X + ϵ
- X = Independent Variable
- Y = Dependent Variable
- Β1 = Intercept of the regression model
- β2 = Slope of the regression model
- ϵ = error term
When we fit variables of our model then the equation looks like:
Dist = β1 + β2(Speed) + ϵ
And when we fit the outcome of our model into this equation it looks like:
Dist = -17.579 + 3.932(Speed)
Now we have a model, we can predict the value of the new dataset by giving inputs to our model.
| Case Number | Speed | Distance |
| 51 | 10 | To be predicted |
| 52 | 12 | To be predicted |
| 53 | 15 | To be predicted |
| 54 | 18 | To be predicted |
| 55 | 10 | To be predicted |
| 56 | 14 | To be predicted |
| 57 | 20 | To be predicted |
| 58 | 25 | To be predicted |
| 59 | 14 | To be predicted |
| 60 | 12 | To be predicted |
We will provide the above speed variable data as an input to our model.
We can predict the value by using function Predict() in Rstudio.
Example:
Input_variable_speed <- data.frame(speed = c(10,12,15,18,10,14,20,25,14,12))

linear_model = lm(dist~speed, data = cars)

predict(linear_model, newdata = Input_variable_speed)
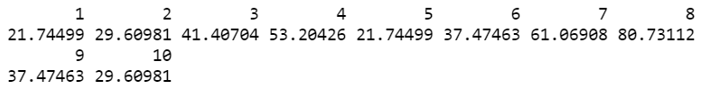
Now we have predicted values of the distance variable. We have to incorporate confidence level also in these predictions, this will help us to see how sure we are about our predicted values.
Output with predicted values.
| Case Number | Speed | Distance |
| 51 | 10 | 21.74499 |
| 52 | 12 | 29.60981 |
| 53 | 15 | 41.40704 |
| 54 | 18 | 53.20426 |
| 55 | 10 | 21.74499 |
| 56 | 14 | 37.47463 |
| 57 | 20 | 61.06908 |
| 58 | 25 | 80.73112 |
| 59 | 14 | 37.47463 |
| 60 | 12 | 29.60981 |
Confidence interval of Predict Function in R
It will helps us to deal with the uncertainty around the mean predictions. By using interval command in Predict() function we can get 95% of the confidence interval. This 95% of confidence level is pre-fitted in the function.
Example
Input_variable_speed <- data.frame(speed = c(10,12,15,18,10,14,20,25,14,12))

linear_model = lm(dist~speed, data = cars)

predict(linear_model, newdata = Input_variable_speed, interval = "confidence")
Output:
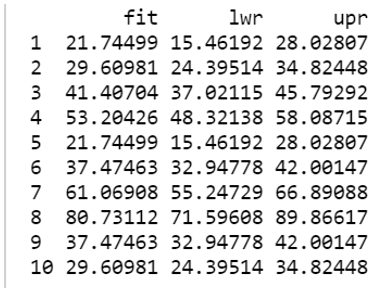
The 95% confidence intervals associated with a speed of 10 are (15.46, 28.02). This means that, according to our model, 95% of the cars with a speed of 10 mph have a stopping distance between 15.46 and 28.02.
Recommended Articles
This is a guide to Predict Function in R. Here we discuss the three types of Predict Analytics along with the Examples and Arguments. You can also go through our other suggested articles to learn more –
