Updated June 22, 2023
Introduction to Google Analytics
Digital Marketing is huge these days. No big industry can be made without a significant investment of money and time; it is necessary to know and benchmark the results and effects of the work. In Digital Marketing, this is achieved by using Analytics tools. On top of the tons of tools available today, Google made a web-based one called Google Analytics. This post will discuss what it is, how it works, and why you should care about it.
What is Google Analytics?
Simply put, Google Analytics is an analytics tool that can be used to track and analyze actions on a website, such as the number of visitors, number of page views, and the site’s bounce rate. It is free to use by any webmaster. However, there is a paid version – and I should add it is a bit expensive for small businesses and publishers – with some advanced features.
While all data is anonymized on it, you can easily understand user behavior and traffic flow of the site alongside traffic sources to understand where visitors to your sites come from.
It has made Android and iOS apps to see the reports on the go, and Google Analytics is one of the few tools on the market that can report live visitors on the site. You can even see from which city a visitor is.
How does it Work?
The core technologies for Google Analytics are Cookies and tracking codes. Like most modern analytics tools, it uses tracking codes to see and measure web performance. You must create a new property after signing up for the service. Once you have done that, the web interface provides you with a code. This little JavaScript code snippet must be added to every site page you want to track.
Now, this sounds like a terrifying task for a site with thousands of pages, but in most CMS, you can find plugins to add the code or, in many cases, add the code to a common header file to get the job done.
Once you are done with this, you should be good to do. Next, you can create custom dashboards on the Google Analytics Web Interface to see and monitor your care about stats. It can be a little confusing initially, but you will be comfortable creating custom dashboards and export custom reports. With time you will be comfortable enough.
Aside from tracking page views and bounce rates, Google Analytics supports event tracking. For example, you can use it to see how many people clicked on the sign-up button.
Features of Google Analytics
Given below are the features mentioned:
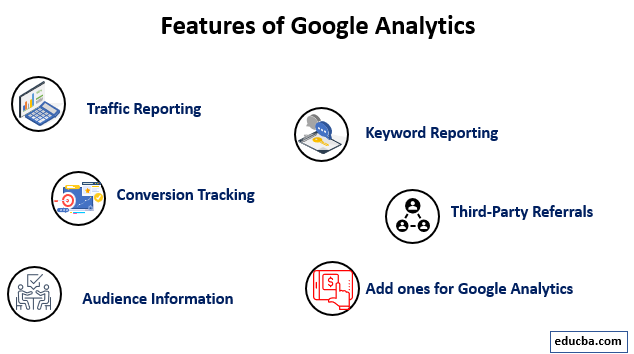
1. Traffic Reporting
These Google Analytics features are about measuring the traffic and their flow on your site. This includes session durations, measuring bounce rates, and measuring new visitors and people who visit your site often; it also can show how your visitors come to the site and what phones or internet connections they use to access it.
2. Conversion Tracking
This is all about tracking conversions to the site. For example, for an e-commerce site, you can create a funnel to measure how many users abandon the cart or add an item to their shopping cart.
3. Keyword Reporting
Alongside telling you which phone or OS your visitors used to visit your site, you can also see which keyword was used by visitors to find you. This can be used to create content on your site for SEO and more traffic to your site.
4. Third-Party Referrals
A digital marketer must understand where traffic to his site comes from. It has a source section that can show a source of traffic. The sources can be a particular Website, Search Engine, or Social Media site.
5. Audience Information
It can also give you information about your audience; in the settings, you can enable options to measure the age, gender, and other details about your audience. Of course, it tracks the language, country, etc., data of visitors by default too.
6. Add Ones for Google Analytics
No Analytics tool in the world can do everything; to deal with this, Google Analytics supports Add ons. These plugins can extend the feature set of Google Analytics and make it possible to customize and modify the experience for the needs. It’s also not that tough to install add-ons; there is a web-based system, so you don’t have to download and upload anything.
Advantages of Google Analytics
Good Analytics software is a must for any digital marker today; among its competition, Google’s offering has a good reputation because of its accuracy and large feature set.
1. It is Free to Use
While a paid version of Google Analytics is available if you want, the free version is more than enough features to blow most paid Analytics tools out of the water. With backing from an internet giant like Google, there is no worry that Google Analytics will disappear overnight, contributing to its reliability.
2. Visitor Segmentations in the Dashboard
One of the most valuable advantages of Google Analytics is that we can easily create segments of the audience to pinpoint and focus on one type of traffic to better analyses it. These segments can be search traffic, mobile traffic, or geography to focus on a particular map area.
3. Traffic Flow Viewing in Google Analytics
It is capable of drawing out audience flow in its dashboard. These flows can be customized to show different sources and types and help understand how people navigate the site.
4. Integration with Other Google Tools
It supports many Google-operated marketing products, such as Google Ads and Google AdSense. Integrating them with Google Analytics makes it easy to understand and view campaign data, visitors, and actions to fine-tune the targeting and audience to improve efficiency.
5. Comparison Features
It makes it a one-click affair to compare the site’s performance over two different periods. This makes it easy to understand how the site is performing, and understanding growth trends also becomes much easier.
6. Viewing Historical Data
Its measures keep all the site-related data from day one and do not delete it even after years; this makes seeing and exporting historical data quick. Aside from viewing past data, you can segregate and process it like you can with recent data on Google Analytics.
7. Viewing Popular or Frequent Pages
It is one of the major advantages of easily seeing the best-performing content on the site. With just one click, you can see pages that perform best – or worst – in aspects of bounce rates, page views, frequency of visitors, etc. Using this; content can be planned around best-performing keywords to capitalize on the ranking articles and keep more audience on the site.
8. Data Exporting for Processing
If you want to dig deeper into the data and find patterns that Google Analytics can’t do, you can export all data captured by Google Analytics and import it to the data processing tool of your choice. Any tool that supports data importing by Excel will support data exported by Google Analytics.
9. Team Member and Providing Access to Members
Even free versions of Google Analytics support user management. You can invite someone to see and work on your website property. To prevent anyone from making any or-reversible changes to the site, you can limit their access.
Value of Google Analytics in the Career of a Digital Marketer
It is one of the most important weapons in a digital marker’s arsenal. The strategies made by a digital marketer can only be understood as working or not if there is a good way of understanding them. Even better, after some experience, you will understand the weak links in your strategy by using Google Analytics and improving the ROI.
Many designations in marketing are only about using Analytics tools; for any of these posts, it is most likely to be the trading tool, and being proficient will be a must if you want a good career.
In the case of a blogger or social media influencer, it is valuable too. They can use the tool to track clicks and click-through rates to see and track any actions that happen in the links of their social media posts.
Conclusion
As we have seen today, it is one of the most essential Analytics tools in the market. Because Analytics plays a vital role in the industry, it would be beneficial for you to have proficiency in it for growth in your career.
Recommended Articles
We hope that this EDUCBA information on “What is Google Analytics?” was beneficial to you. You can view EDUCBA’s recommended articles for more information.
