Updated March 23, 2023
Introduction to Hierarchy in Tableau
The hierarchy in Tableau is an arrangement where entities are presented at various levels. So, there’s an entity or dimension under which there are further entities present as levels. In Tableau, we can create hierarchies by bringing one dimension as a level under the principle dimension. The main dimension is the one over which we create the hierarchy. When it comes to analysis, the concept of hierarchies proves handy, as we don’t have to bring all the dimensions separately into analysis. Having meaningful hierarchies in the analysis is thus useful as we can expand from and contract to the main dimension as needed.
Creating and Removing Hierarchies in Tableau
In the following section, we shall see how to create, use and remove hierarchies. Before creating hierarchies it must be ensured that the intended hierarchies are meaningful in nature. For this demonstration, we are using the Distribution Unit Volume dataset. The dataset contains volume distributed for a product by distribution units. Important dimensions in the dataset are Region, Distribution Unit, City, DU Code, and Mode while Distribution Volume is the measure.
Here we’ll define a hierarchy for geographical dimensions which are Region, Distribution Unit, and City. Region is the largest unit followed by the Distribution Unit which is followed by City. The city has been represented in the form of codes.
Creating Hierarchy
Let’s proceed to understand how to create hierarchies in Tableau in order to accomplish the above task.
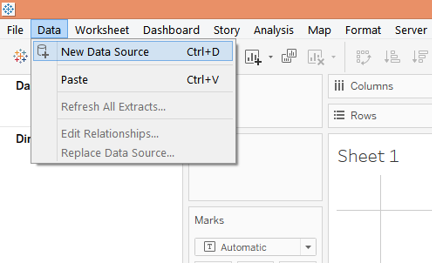
1. First, load the dataset into Tableau. For that click on “New Data Source” under the Data tab. Alternatively, click on “Connect to Data”.
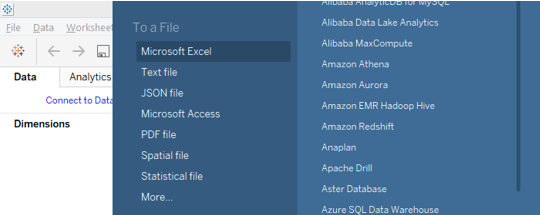
2. In the section that pops-up, select the requisite data source type. In this case, it is MS Excel, so we selected Microsoft Excel.
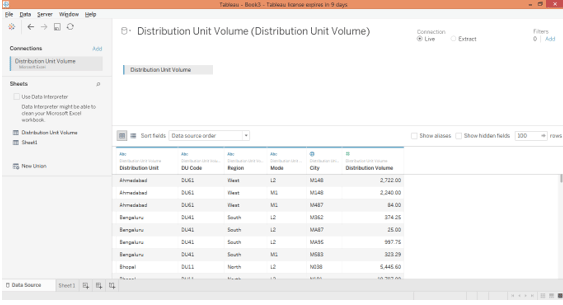
3. We can visualize the loaded data in the “Data Source” tab. Examine the data prior to proceeding to analysis. The data must be intact for correct results.
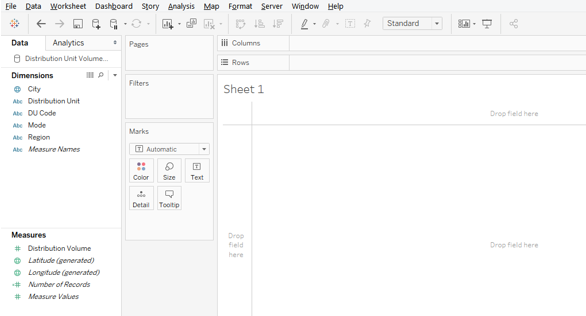
4. Moving to the sheet tab, we can find the dimensions and the measure present in the requisite sections.
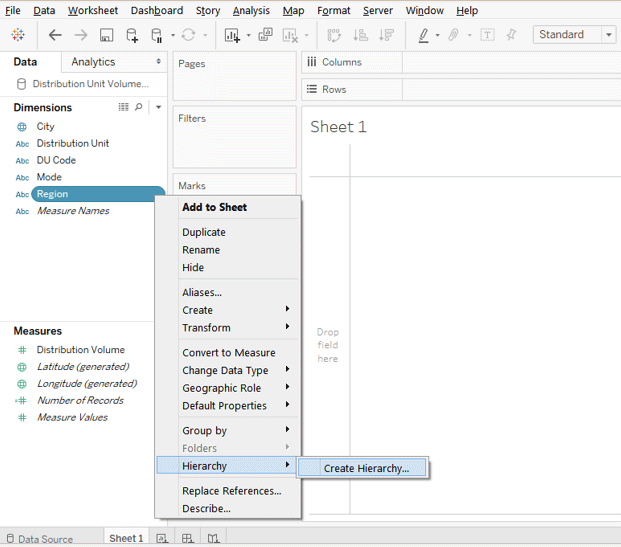
5. We want to create Region -> Distribution Unit -> City hierarchy. In order to create this hierarchy, click on the drop-down menu of the Region dimension. From the menu, in the “Hierarchy” option, click on the “Create Hierarchy” option.
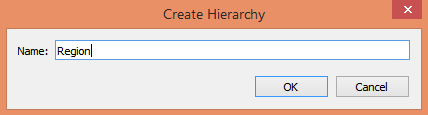
6. Following the above procedure generates a simple dialogue box for naming the hierarchy. We will name it as Region which is as shown as follows. Once naming is done, click on Ok.
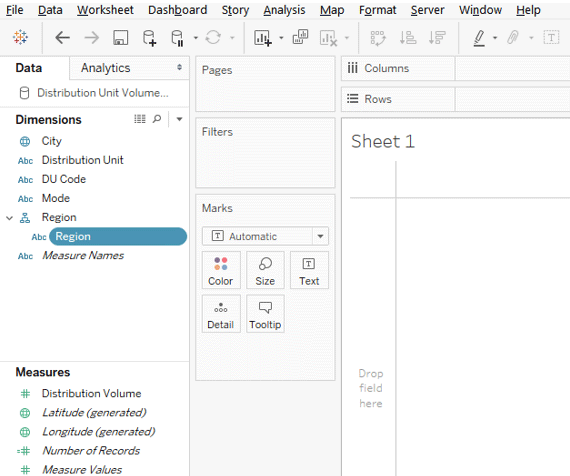
7. The newly created hierarchy appears under Region dimension as can be seen in the below image. Note, now there exists only one level which is nothing but the one represented by the dimension over which the hierarchy has been created.
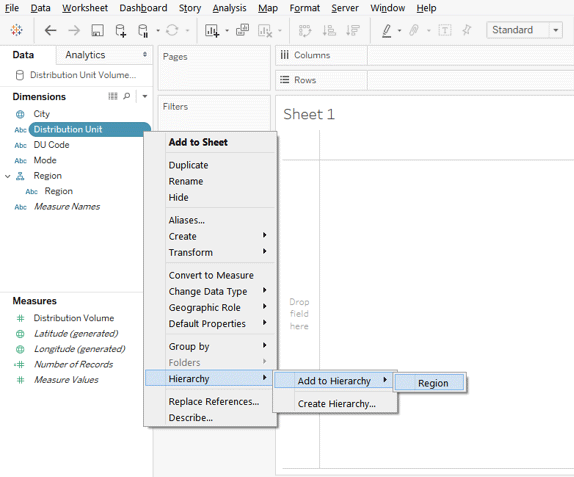
8. The next level in the intended hierarchy is the Distribution Unit. So, we need to add this dimension to the next level. For that, in the drop-down menu of the dimension “Distribution Unit”, click on the “Hierarchy” option. Now, here, two options will appear viz. “Add to Hierarchy” and “Create Hierarchy”. We have already created a hierarchy into which we just want to add the dimension Distribution Unit. So, in the “Hierarchy” option, click on “Add to Hierarchy”, and select “Region”.
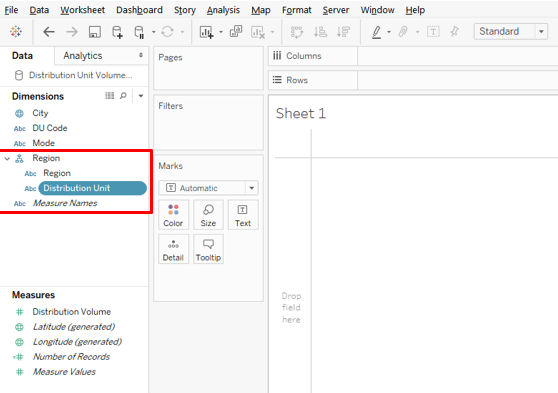
9. The above steps lead to the creation of the second level in the hierarchy Region. This is as shown by the following image.
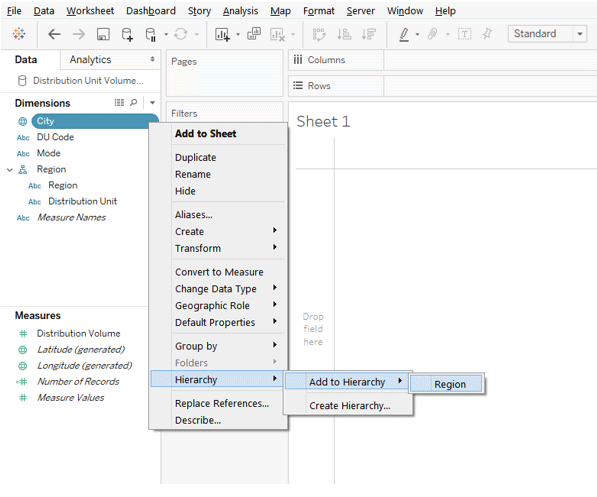
10. Now, following the same procedure as described in the preceding part, we shall add City dimension as the third level in the hierarchy as shown below.
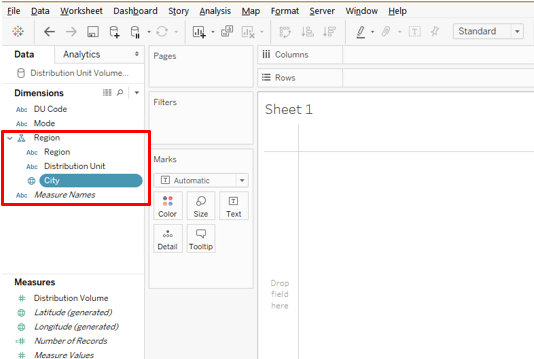
11. The above steps lead to the creation of the third level in the hierarchy which is City as highlighted below.
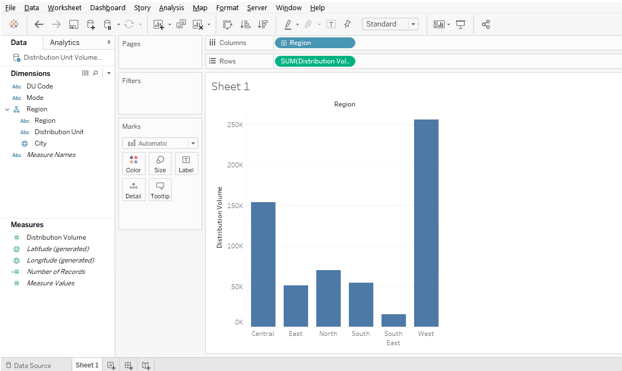
12. Now that hierarchies have been created, we shall use them in analysis. Drag the Region dimension over which hierarchies were created into Columns Region and measure Sales in Row. We get the following vertical graph.
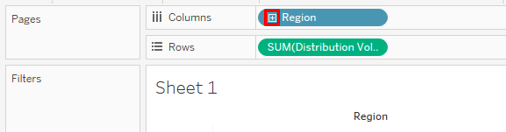
13. The following image gives a closer look into Region dimension which contains hierarchies. Notice, a plus symbol appears which means the dimension contains hierarchies. In order to expand the hierarchies, click on the plus symbol.
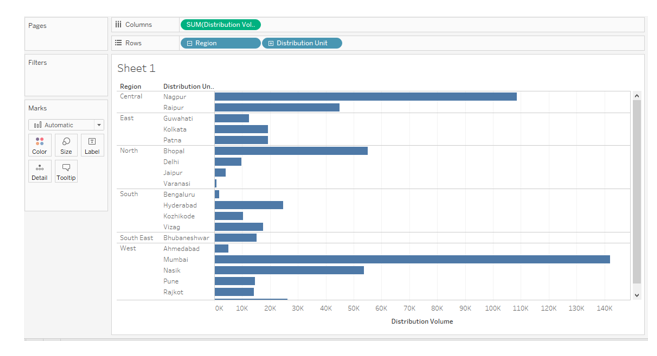
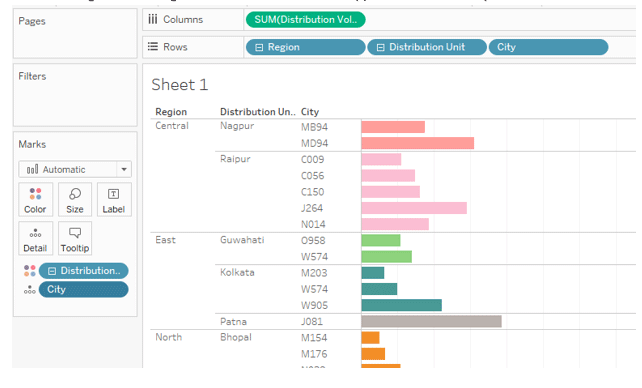
14. For better analysis, we will convert the vertical graph into a horizontal one as shown in the below image.
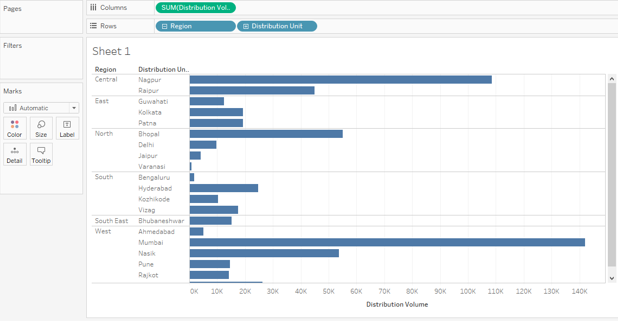
15. When we click on the plus symbol in the Region dimension, the next level appears which, in this case, is the “Distribution Unit”. Now, note that Region has expanded to the next level, so minus appears before the Region dimension, while for level Distribution Unit plus appears, which means that more level(s) is(are) are there.
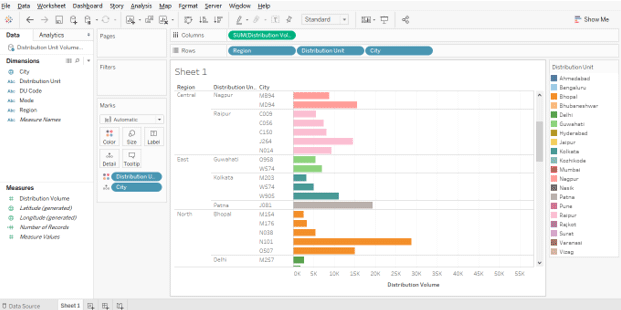
16. Now, as shown in the following image, we first expanded the Distribution Unit level and minus now appears for it. The next level that gets generated is City. Note, for City, there’s no sign either positive or negative, which means that no further level exists. All the three levels in the defined order are there in the Rows region. When we dragged the Distribution Unit over Color in Marks Card, we can see that City got dragged automatically over the Detail section in the Marks Card. This is because of the hierarchy.
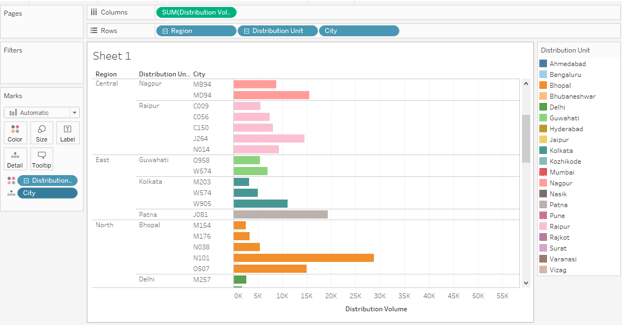
17. The Following screenshot gives us a closer look into the application of hierarchy.
Removing Hierarchy
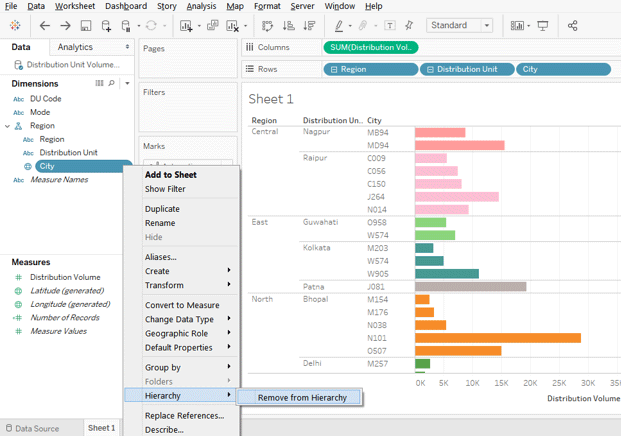
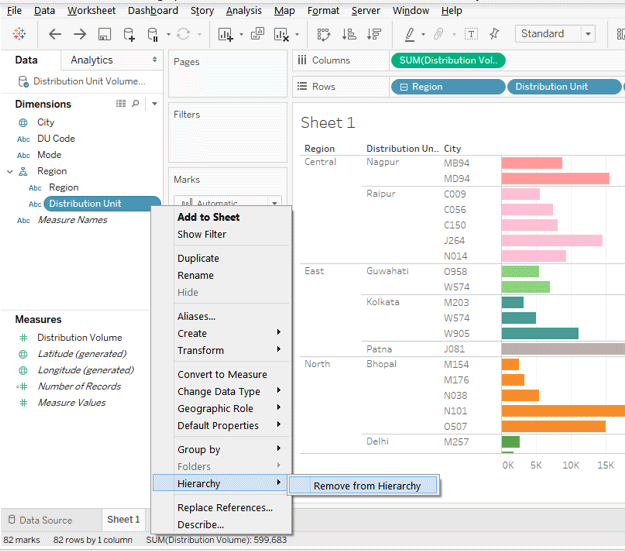
18. Now, it is important to note that once the analysis is done or requisite insights have been obtained, it is always good to have the hierarchies removed. How we can accomplish that, let’s see. Remove the hierarchy in order, so, click on the drop-down menu of City, then in “Hierarchy” click on “Remove from Hierarchy”. This has been illustrated in the below screenshot.
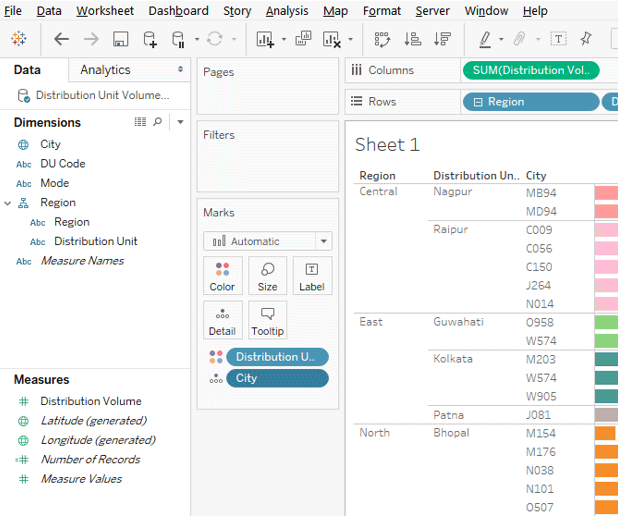
19. In the below screenshot we can see that City dimension no more appears in the Region hierarchy.
20. Following the same steps as above, remove the dimension “Distribution Unit” from the hierarchy.
21. Similarly, we remove Region dimension too over which only we had created the hierarchy. Note that the analysis remains intact. This is because the hierarchy has been removed and not the dimensions. And this is shown by the disappearance of the plus and minus symbols from the dimensions in the Rows region.
Conclusion
Having hierarchies containing the desired number of levels representing requisite dimensions is always helpful. Hierarchies are a very powerful tool as they enable strong view-level analysis without actually affecting the original dataset. In Tableau, using hierarchies, one can drill-down data as needed. This proves quite useful especially in situations involving complex problems.
Recommended Articles
This is a guide to Hierarchy in Tableau. Here we discuss how to create, use and remove hierarchy in tableau. You may also look at the following articles to learn more –
