Updated March 23, 2023
Difference Between Google Data Studio and Tableau
In this article, we will see an outline on Google Data Studio vs Tableau. We all are brought up learning different types of charts and graphs from our schooling to understand how-to portray the given data in a better understandable manner. Likewise, in our real world, where we see many Analysts/Managers talk about drawing out visualizations from the data set and bringing out actionable insights, i.e., could be employee’s periodical data and to measure how they are performing in quarterly or annually wise. Let’s see how this all happens by knowing more about Google Data Studio, Tableau, and its comparison. No more wait; let us dig into how they are unique and different to each other, where each of them almost serves the same purpose, i.e., Data Visualization.
What is Google Data Studio?
Looking into the history of GDS in Cloud Services, technically, it is launched in mid of 2016 and later with a Beta version in 2018. For beginners, this tool welcomes you to have a good understanding and exposure to Report building. Google’s Data Studio is for free; all it needs is logging in with Google’s credentials. Using GDS, one can perform many types of flexible Reports using charts and tables, i.e., Time series, Pie charts, Line, Area, Scatter charts, and some advanced charts.
Especially if you are a freelancer, this is the best pocket-friendly tool to pull out the Analytics in the best form and deliver the same to your end customer would allow you to save budget and able to manage well in the Project. Believe it or not, there are more than 60% of Start-up’s and Freelancers depend on this Google Data Studio to perform Reporting.
What is Tableau?
Tableau was introduced into the market in May 2013; since then, it never looked back after the success of earning $250 million in its first shot of the New York Stock Exchange. Now, it’s leading as a top visualization tool for Gartner’s magic quadrant in B.I. Comparatively, with any other tool in the market, it is the most powerful and fastest-growing Visualization tool with charts like Bubble, Dual-axis, Gantt, Box plot and Geographical charts.
The whole Tableau product suits are consisting and available in the following types:
- Tableau Desktop
- Online
- Public
- Reader and Server
Each product type comes up with a different and mixed purpose. Where the Desktop/Public versions allow to create of visualizations and the Online/Server version is for sharing and publishing the Reports were working sheets could be edited, and finally, the Reader version is only for viewing purposes. Tableau is built with rich features that allow you to code and build any customized visualizations upon blending the different datasets to make a Dashboard or a Storyboard.
Do you want to understand why it is a top-performing tool? Irrespective of any other, Tableau connects with 60+ data sources and can manipulate data into various forms and bring any type of advanced Visuals into it by coding and customizing. It handles the millions and trillions of data in Live/Extract mode, where execution is defined by working users. Like this, the tool Developers have provided endless flexible features, so it simply and solely depends on the End-user on how to utilize and use it.
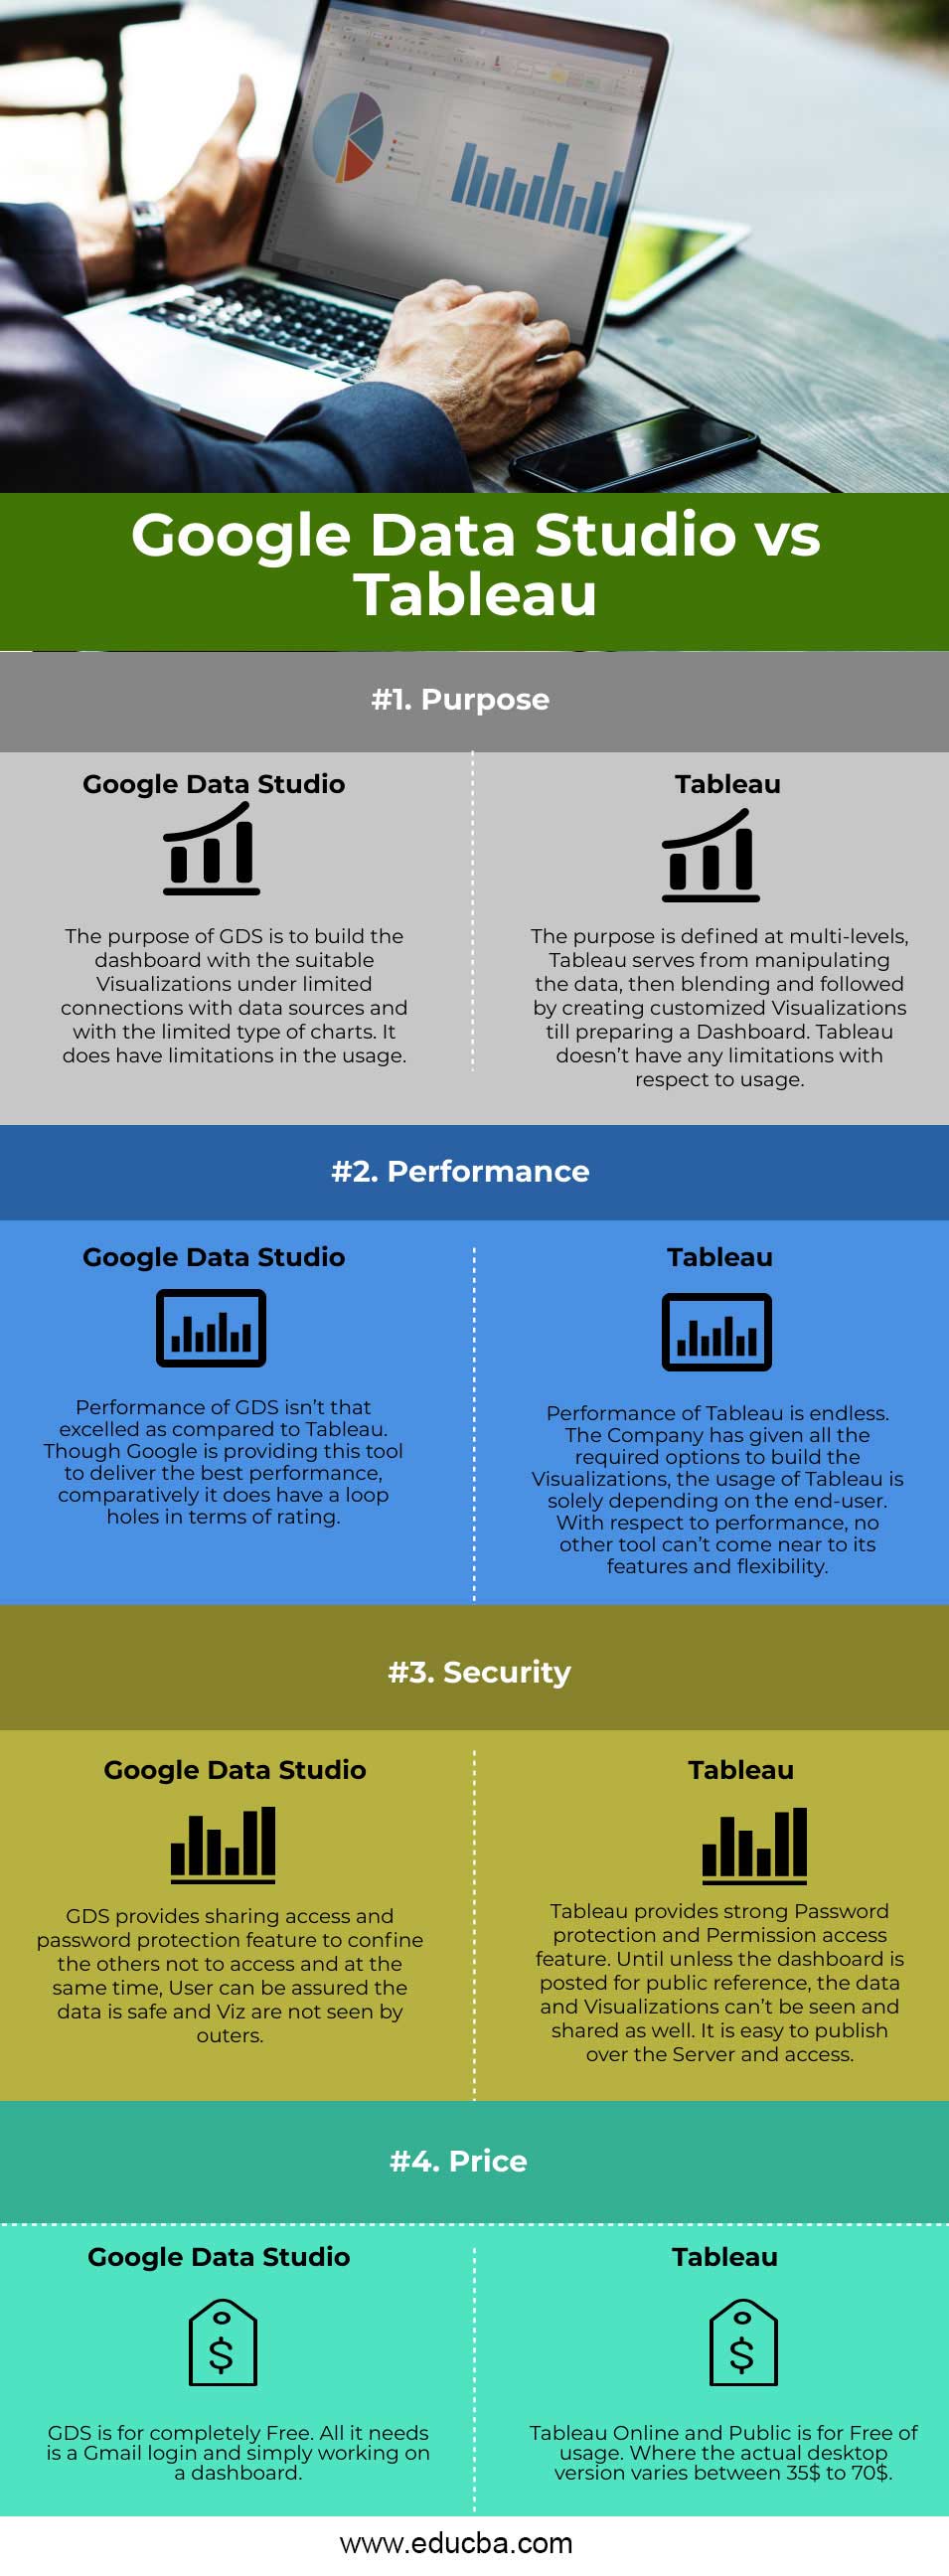
Head to Head Comparison between Google Data Studio and Tableau (Infographics)
Below are the Top 4 comparisons between Google Data Studio vs Tableau:
Key differences between Google Data Studio vs Tableau
Let us discuss some key differences between Google Data Studio vs Tableau in the following points:
- User Interface: In both Google Data Studio and Tableau, the User interface is simple and straight. The featuring is just drag and drop, where it is more effective in Tableau as it holds more options and a higher scope to perform any action; building a Dashboard on Tableau is immeasurable and Incomparable to Google Data Studio.
- Limitations: In GDS, limitations are connecting with the data sources as it allows us to connect to limited connections, where Tableau has a wide range of connections, i.e., 60+ to connect the data sources.
- Business Need: Tableau has the highest business scope, as it serves the complete purpose of end to end the building of Dashboards, where GDS also serves but partial service. Tableau is purchased and used by the Corporates and mid-level companies, where Start-Ups and Freelancers are using GDS.
- Community Support: Tableau has a wider community support area, where any posted query would get an answer in less than 24 hours. Here in GDS, Community is not that par but gives your relevant solutions in point of time.
Comparison Table of Google Data Studio vs Tableau
The table below summarizes the comparisons between Google Data Studio vs Tableau:
| Parameters | Google Data Studio |
Tableau |
| Purpose | The purpose of GDS is to build the dashboard with suitable Visualizations under limited connections with data sources and with the limited type of charts. It does have limitations in usage. | The purpose is defined at multi-levels; tableau serves from manipulating the data, then blending and followed by creating customized Visualizations till preparing a Dashboard. Tableau doesn’t have any limitations with respect to usage. |
| Performance | The performance of GDS isn’t that excelled as compared to Tableau. Though Google is providing this tool to deliver the best performance, comparatively, it does have a loophole in terms of rating. | The performance of Tableau is endless. The Company has given all the required options to build the Visualizations; the usage of Tableau is solely depending on the end-user. With respect to performance, no other tool can’t come near to its features and flexibility. |
| Security | GDS provides sharing access and password protection feature to confine the others not to access and at the same time, User can be assured the data is safe, and Viz are not seen by outers. | Tableau provides strong Password protection and Permission access feature. Unless the dashboard is posted for public reference, the data and Visualizations can’t be seen and shared as well. It is easy to publish over the Server and access. |
| Price | GDS is for completely Free. All it needs is a Gmail login and simply working on a dashboard. | Tableau Online and Public are for Free of usage where the actual desktop version varies between 35$ to 70$. |
Conclusion
Both Tableau and GDS are good Visualization tools. Comparatively, Tableau has more features and community support, which outperforms Google Data Studio. I hope you had a good tour of understanding brief about each other and the differences.
Recommended Articles
This is a guide to Google Data Studio vs Tableau. Here we also discuss the key differences with infographics and comparison table. You may also have a look at the following articles to learn more –
