Updated June 8, 2023
F-Test in Excel
F-Test is a statistical tool in Excel used for Hypothesis Tests with the help of variance of 2 datasets or populations. We calculate whether the Null Hypothesis (H0) for the given data set is TRUE. This can be sure when the variance of both the data sets is equal. To perform F-Test, go to the Data menu tab, and from the Data Analysis option, select F-Test Two-Sample Of Variances. Select both the data population in the variable 1 and 2 range, keeping alpha as 0.05 (Standard for 95% probability). This will give us a final F-Test Calculation. If F > F Critical One Tail, we will reject the Null Hypothesis, meaning that the selected data populations are unequal.
How to do F-Test in Excel?
F-Test in Excel is very simple and easy. Let’s understand the working of F-Test in Excel with some examples.
Excel F-Test – Example #1
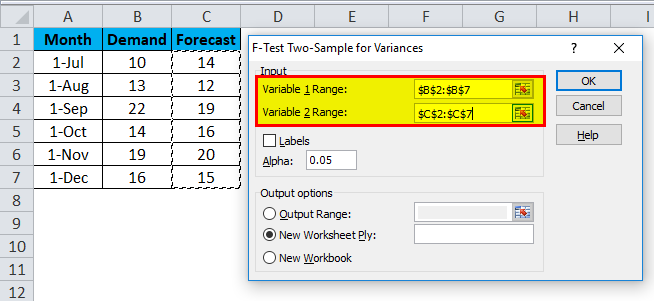
Suppose we have 6-month data of Demand and Forecast of any product. Data is in A2:C7.
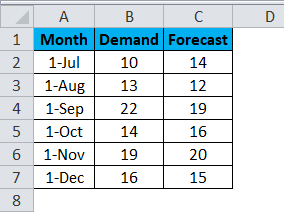
Now, if we want to test the variation and difference in the variability of data.
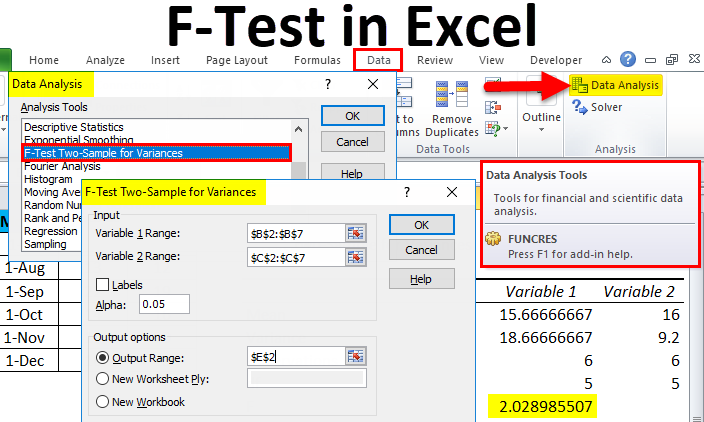
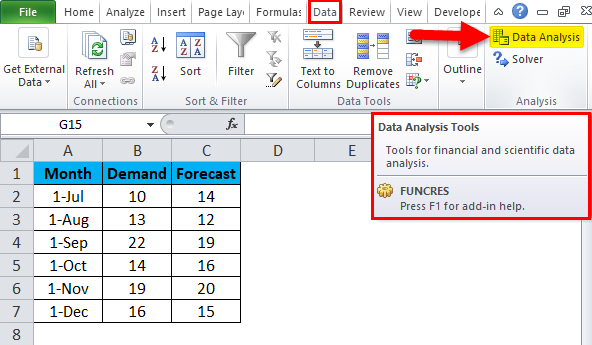
- Go to Data in the Menu bar and select Data Analysis.
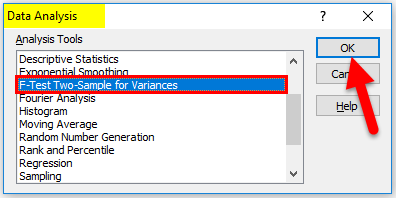
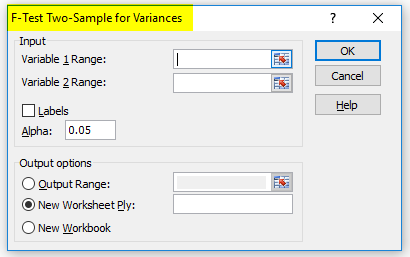
- Once you click on it, a Data Analysis option box will come up. Now select F-Test Two-Sample Variances and click on Ok.
- After that, another dialog box of F-Test will appear.
- Here you need to select the variable range of Demand and Forecast from the data shown below.
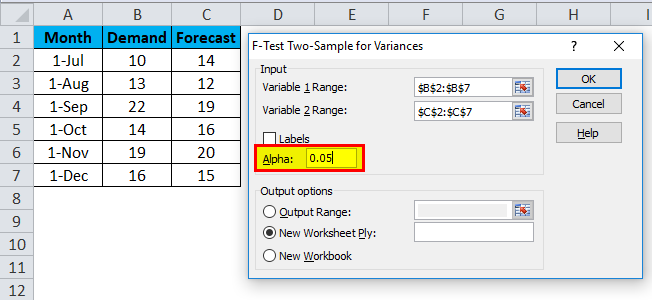
- After selecting the Variables 1 Range and Variable 2 Range, choose the desired value of Alpha in the same box. Here, we have taken 0.05 as Alpha, which means we consider 5% tolerance in calculation and analysis.
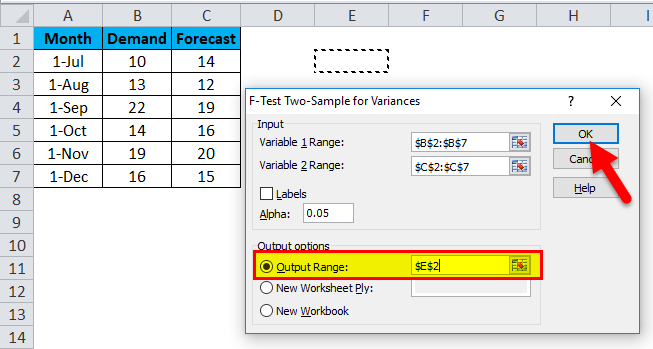
- After that, select the Output Range cell anywhere in the same sheet, or else, you can select a New Workbook, which is given just below it, for your ease. Here we have selected the output range as E2, then click OK.
- An F-Test in Excel will look like the below.
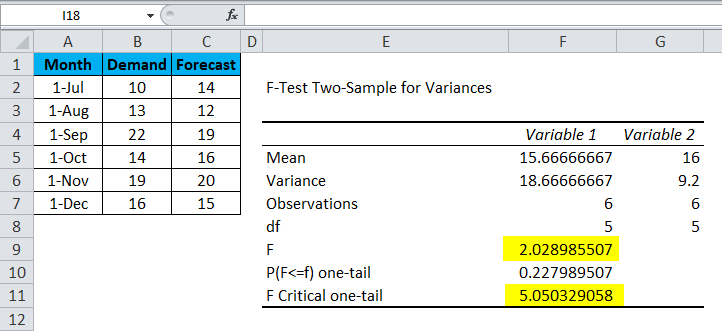
Now let’s analyze the above data;
- The mean of Variables 1 and 2 are 15.66666667 and 16, respectively, the mid-point of Demand and Forecast.
- A variance of Variables 1 and 2 are 18.66666667 and 9.2, respectively, showing the variation in the data set.
- Observations of Variables 1 and 2 are 6, meaning only 6 data points or parameters are considered in doing F-Test.
- df Degree of Freedom indicates that only 5 variables can be assigned to this statistical distribution.
- P (F<=f) one-tail is the probability distribution of variation in both the data set, which is coming to 0.227989507 (22.7% appx).
As you can see, the value of F is 2.02898507, which is lesser than the value of F Critical one-tail, which means this Null Hypothesis can be accepted.
Excel F-Test – Example #2
Suppose we have Delivery data of some Part Numbers. For better understanding, we have sorted the data in ascending order with column name Date of Delivery, as shown below.
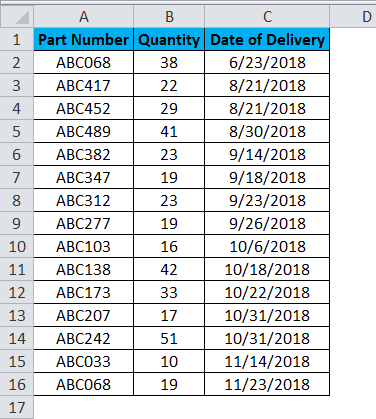
Follow the same process for this data for performing F-Test in Excel. The data set has only one column with statistical or numeric figures. Here, the analysis will be based on segmenting the dates into two sections.
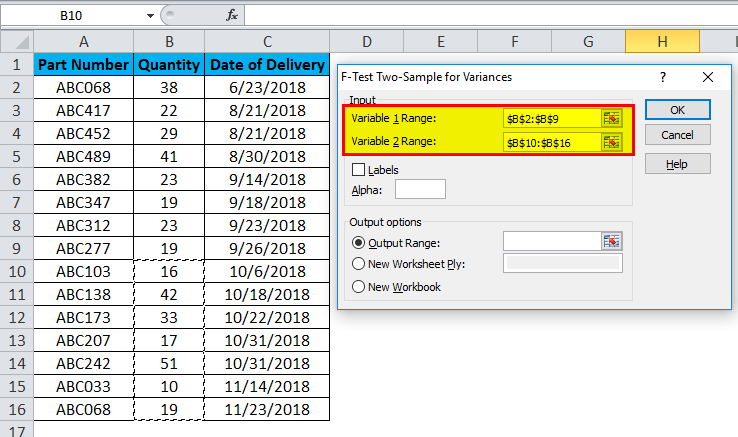
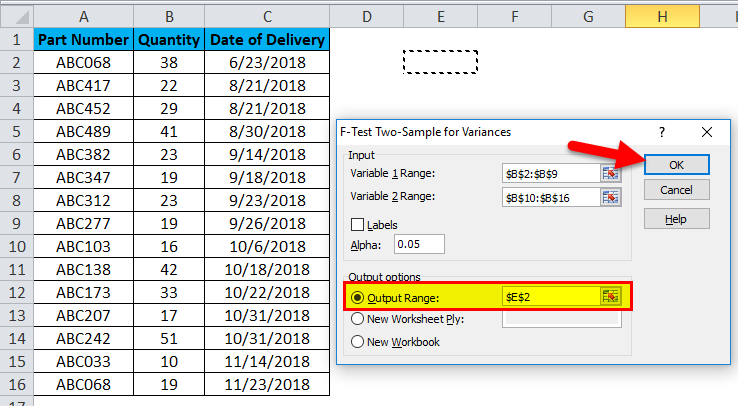
- As you can see in the below screenshot, for Variable 1, the Range data selected is from B2:B9, and for Variable 2 Range data selected is from B10:B16.
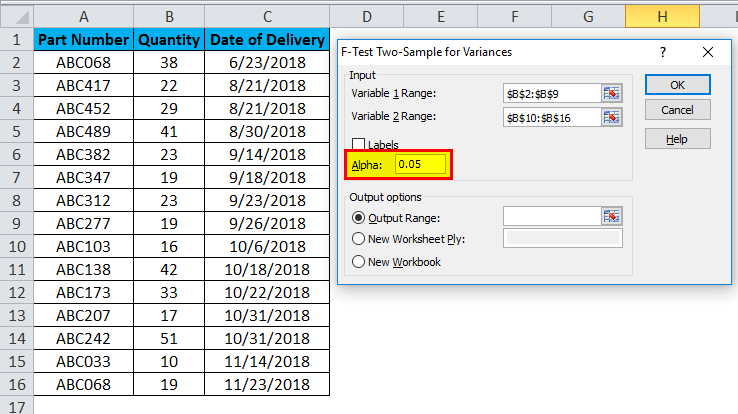
- Alpha is kept at 0.05, which is 5% of tolerance (You can change the value of Alpha as per data size and requirement).
- Then select Output Range Cell and click OK.
- An F-Test in Excel for Delivery Data of shown Part Numbers will look like this:
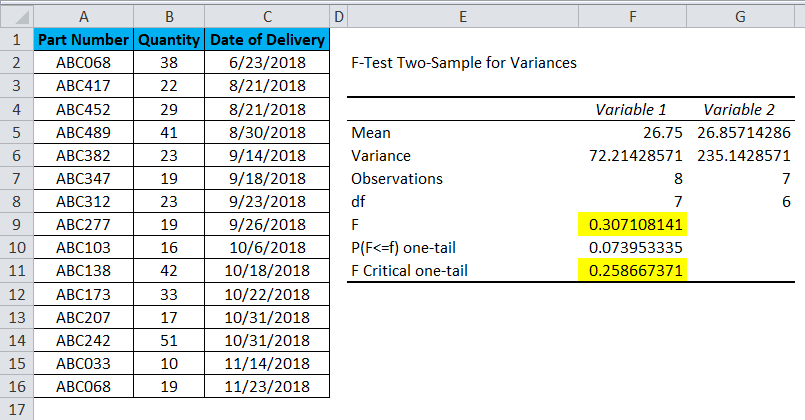
Now let’s analyze the above data;
- The mean of Variable 1 is 26.75, and the mean of Variable 2 is 26.85714286, representing the mid-point of Quantity Delivered. There is not much difference between these parameters.
- A variance of Variables 1 and 2 are 72.21428571 and 235.1428571, respectively, showing the variation in the data set.
- The observations of Variables 1 and 2 are 8 and 7, respectively, indicating 8 selected upper data points and 7 selected lower data points.
- df is the Degree of freedom shown, and only 7 and 6 variables can assign to the upper and lower data set in this statistical distribution.
- P (F<=f) one-tail is the probability distribution of variation in both the data set, which comes as 0.073953335 (7.3% appx).
As you can see, the value of F is 0.307108141, which is greater than the value of F Critical one-tail, which means that this Null Hypothesis cannot be accepted.
Pros of F-Test in Excel
- It can use in any statistical data set where a comparison of Before/After, Latest/Previous can be performed to accept whether the statistical data can accept.
- Mean gives the mid-value, the average of total values; Variance is the difference between the actual or predicted/future value. So, centricity can see easily.
Cons of F-Test in Excel
- For un-statistical background people, it becomes difficult to understand and measure different observations.
- If there is very little difference in F and F Critical one-tail values, then it becomes very difficult to accept or reject the test while performing in real-life scenarios.
Things to Remember
- F-Test can perform on one or more than one set of data in Excel. It is not restricted to a data set which has two parameters.
- Always sort the data before performing F-Test in Excel. And the sorting parameter should be the base which is correlated with data.
- Do the basic formatting before performing the F-Test to get a good sanitized output.
Recommended Articles
This has been a guide to F-Test in Excel. Here we discuss its pros and cons and how to do F-Test in Excel, along with Excel examples and a downloadable Excel template. You can also go through our other suggested articles –
