Updated July 24, 2023
Introduction to Correlation Example
The following Correlation examples outline the most common set of Correlation examples:
Example #1
Below, we mention the height and weight of 5 students in a class:
| Student Name | Height (in cm) | Weight (in kgs) |
| Frank | 160 | 53 |
| Leo | 165 | 61 |
| Jerry | 172 | 74 |
| Celeste | 150 | 51 |
| Tracy | 180 | 82 |
Based on this simple data on the Height and Weight of students, we can observe a correlation pattern that is positive. The data suggest that weight increases with greater height, and the inference we draw from the correlation implies that taller people usually weigh more.
We can observe similar types of examples in the positive correlation between an increase in temperature and refrigerator sales.
Example #2
Below, we provide the speeds of different trains and the times they take to reach the same destination.
| Train Name | Speed (in km/hr) | Time Taken (in hrs) |
| A | 40 | 5 |
| B | 50 | 4 |
| C | 80 | 2.5 |
Here we can easily observe the Negative Correlation that Speed and Time taken have with the greater the speed of the Train, the fewer hours are taken to reach the destination.
Example of Correlation (With Excel Template)
Let’s take an example to understand the calculation of the correlation in a better manner.
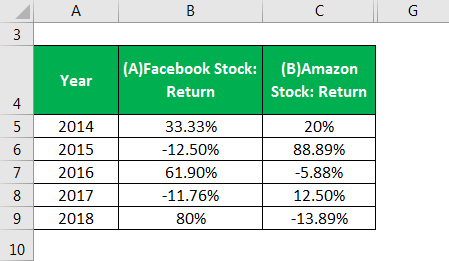
Correlation – Example #1
The following table exhibits the returns on ABC Limited’s two stocks in their Model Portfolio for the last 5 years. Based on the same, let us calculate and interpret the correlation between the two stocks.
Solution:
We will use the Pearson Correlation Coefficient to determine the two assets’ correlation. This method, one of the most popular for measuring the linear relationship between two variables, will help us understand the relationship between two stocks: Facebook and Amazon, in our case.
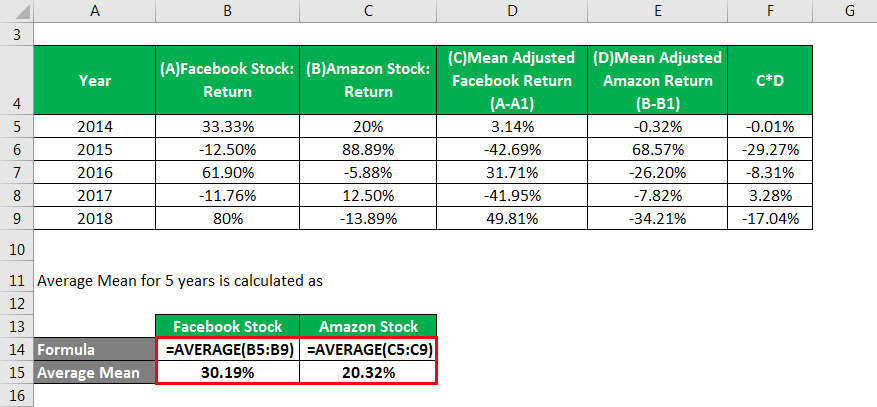
The average Mean for 5 years is calculated as
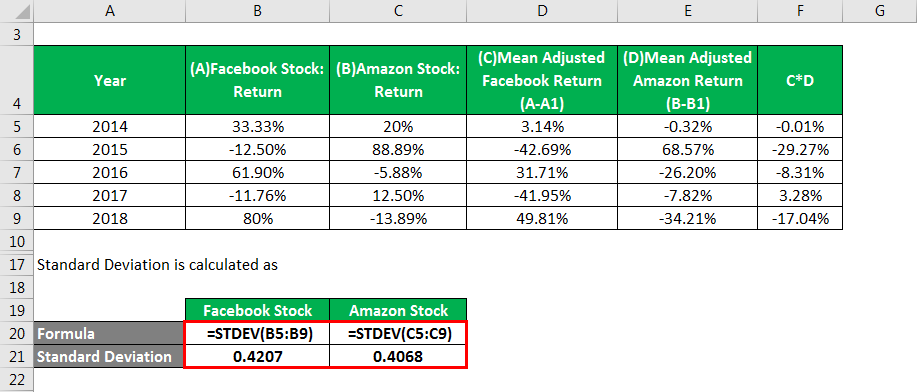
The standard deviation is calculated as
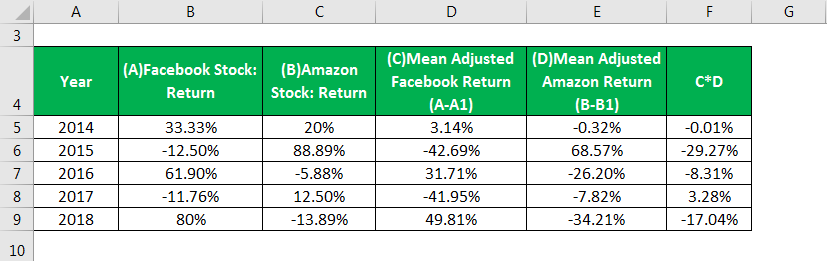
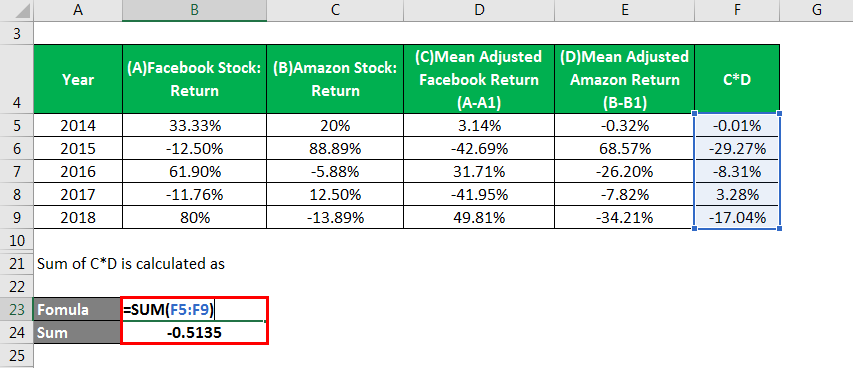
The Sum of C*D is calculated as
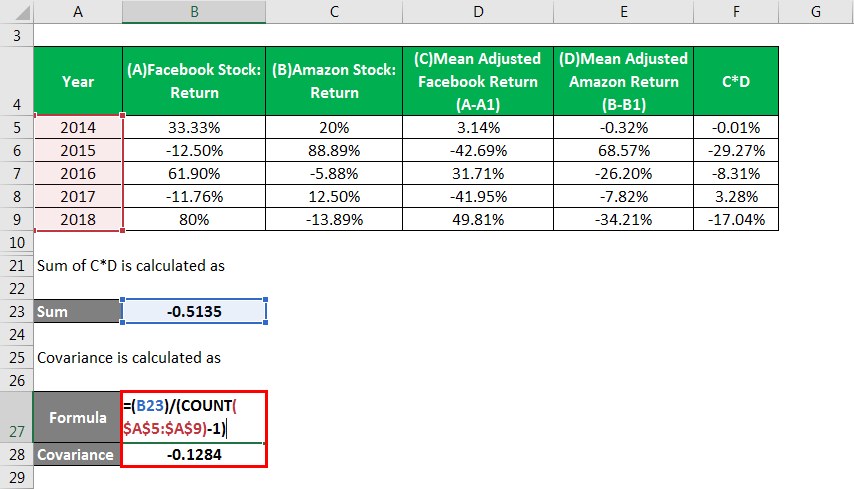
Covariance is calculated as
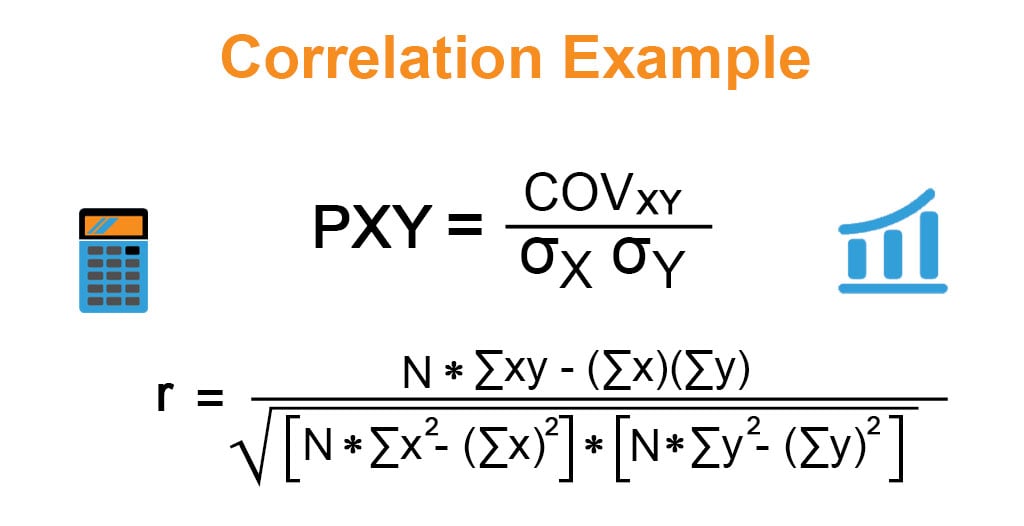
Correlation is calculated using the given formula below
Pearson Correlation Coefficient = ρXY = covXY / σXσY
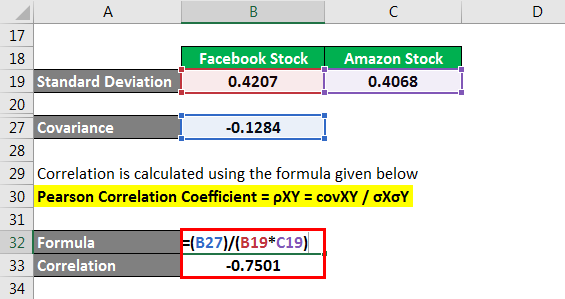
The Correlation of Negative 0.7501 implies a low to high Negative Correlation between the two stocks.
The correlation discussed in the above example is the Pearson Correlation Coefficient method. It helps measure the linear relationship between the two variables, which in our case was the two stocks in the model portfolio.
Correlation – Example #2
Let’s take another example and understand correlation measures using a popular approach called Spearman Rank Correlation. It is an Ordinal Correlation measure, and correlation calculation is undertaken based on the relationship between the rank of the variables.
Solution:
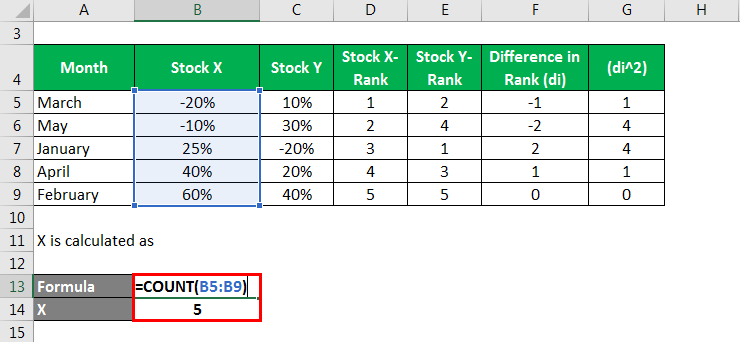
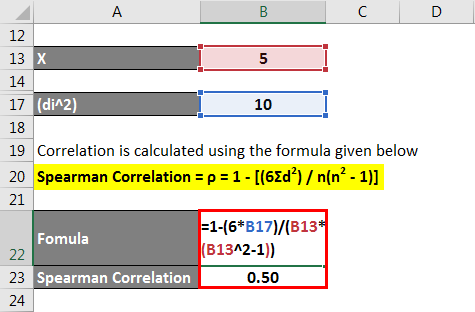
X is calculated as
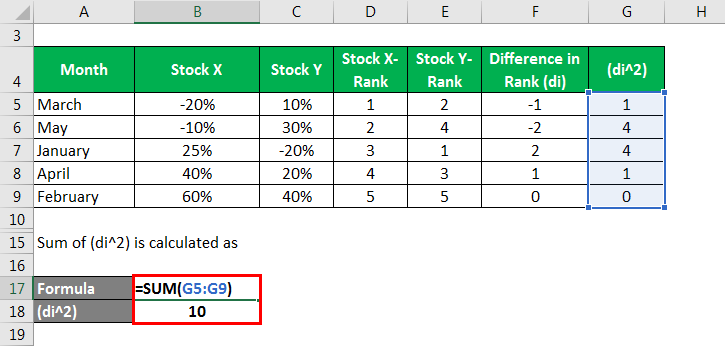
The sum of (di^2) is calculated as
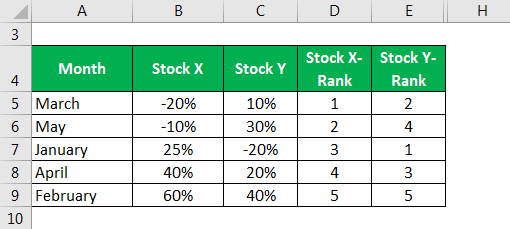
The following table exhibits the returns on two stocks, X and Y, for the last 5 months. Based on the same, let us compute and interpret the correlation between the two stocks using the Spearman Rank Correlation method.
Correlation is calculated using the formula given below.
Spearman Correlation = ρ = 1 – [(6Σd2) / n(n2 – 1)]
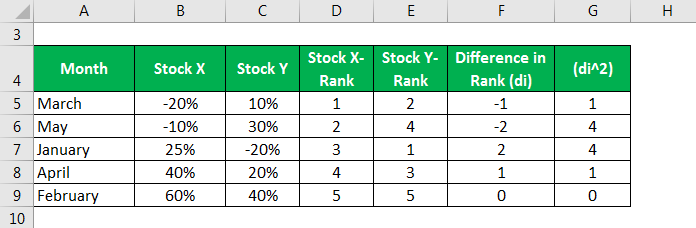
We calculate correlation using the Spearman Correlation method by first ranking the returns of Stock X from lowest to highest in the second column. We then list the returns for Stock Y in the third column for each respective month. The fourth and fifth columns list the return for Stock X and Y rank-wise. The sixth column lists the rankings for each month, and the seventh column determines the sum of squared differences in rankings.
Correlation – Example #3
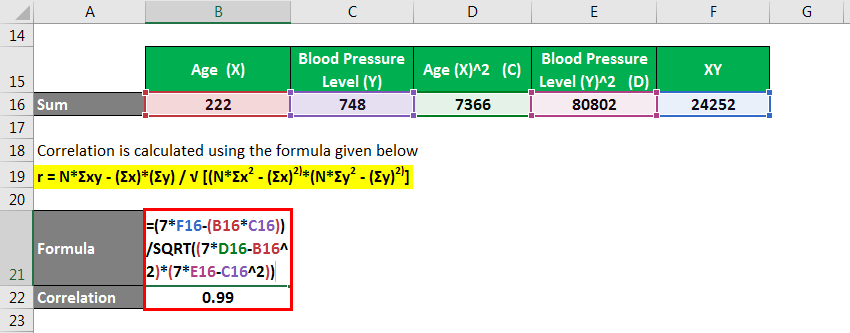
The following data is observed from the medical reports of 10 patients categorized based on their Age and Blood Pressure Level. Based on the same, let us calculate the Correlation Coefficient.
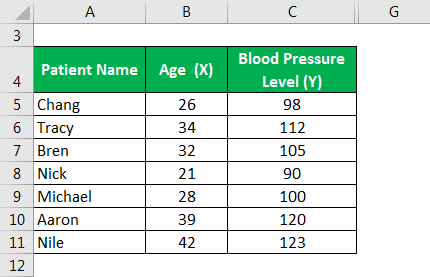
Solution:
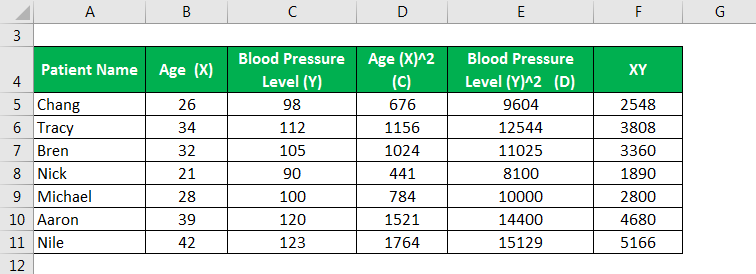
We calculate the sum as follows
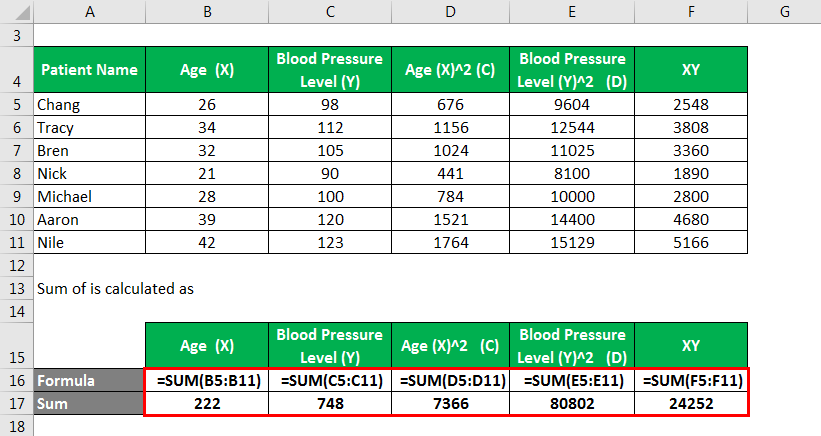
We calculate correlation using the formula given below
r = NΣxy – (Σx)(Σy) / √ [NΣx2 – (Σx)2][NΣy2 – (Σy)2]
Conclusion
We encounter examples of correlation in our day-to-day life, and they help us understand the relationship between two things. Researchers often use it for predicting purposes and validating any relationship between different variables. The correlation coefficient varies from -1 to 1 values where -1 indicates a strong Negative Correlation and 1 indicates a strong Positive Correlation between the variables, and a Correlation value of Zero indicates no relationship between the two variables. We have discussed both simple and practical examples above to validate the concept of correlation and its relevance in statistical and other analytical studies.
Recommended Articles
This is a guide to Correlation Example. Here we discuss calculating the correlation using different methods with different examples. You may also look at the following articles to learn more –
