Updated June 14, 2023
Introduction to Colormap in MATLAB
MATLAB, or Matrix Laboratory, is a programming language that MathWorks developed. This powerful language finds its utility in technical computing. MATLAB provides us with a convenient environment that can be used to integrate tasks like manipulations on matrix, plotting data and functions, implementing algorithms, creating user interfaces, etc. MATLAB is also convenient as it gives the solutions in a form its user can easily understand. It uses mathematical notations to display the solutions. In this topic, we are going to learn about Colormap in Matlab.
Below are a few areas where we can use MATLAB:
- Computation
- Development of Algorithms
- Modeling
- Simulation
- Prototyping
- Analysis and Visualization of data
- Scientific graphs
- Engineering graphics
- Developing applications
MATLAB comprises several techniques and functions to perform the capabilities mentioned above. This article aims to have a thorough understanding of colormaps in MATLAB. As the name suggests, the purpose of colormap is to define the colors of the graphics objects like image, surface, and patch objects. A colormap is a matrix with values between 0 & 1.
Colormaps can have any length, but width-wise, they must have 3 columns. Each row of the matrix defines one color by using an RGB triplet. As you might be aware, the RGB triplet is a 3-element row vector with elements specifying the intensities of red, green & blue colors. As mentioned above, these intensities are in the range [0, 1]. 0 indicates no color & 1 shows the full power of the color.
Below is the list of RGB triplets to get various colors:
| Color | RGB Triplet |
| Yellow | [ 1 1 0 ] |
| Magenta | [ 1 0 1 ] |
| Cyan | [ 0 1 1 ] |
| Red | [ 1 0 0 ] |
| Green | [ 0 1 0 ] |
| Blue | [ 0 0 1 ] |
| White | [ 1 1 1 ] |
| Black | [ 0 0 0 ] |
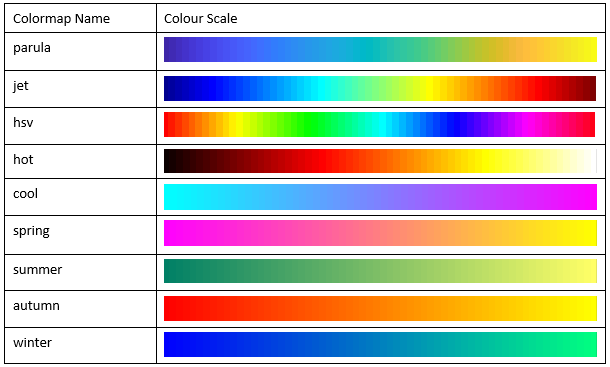
MATLAB also supports some pre-defined colormaps.
Below is the table showing codes for these pre-defined colormaps:
Below is the list of SYNTAX used for colormap:
colormap(map)
cmap = colormap
cmap = colormap
Examples of Colormap in Matlab
Let us now understand these ones by one with the help of examples:
1. colormap map
This command sets the figure’s color to some pre-defined colormap. While using this command, we cannot specify the length of the colormap as per our choice. The axes and charts in the figure will use the same color map as the pre-defined colormap we selected.
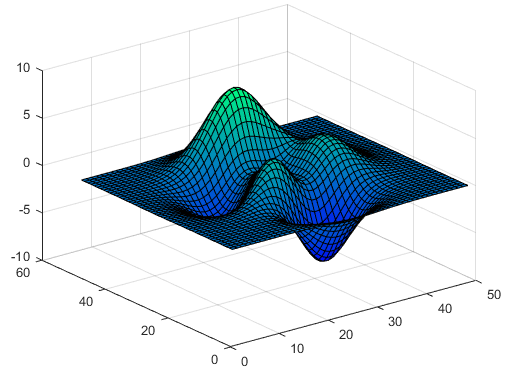
Example: We will create a surface plot and will set the colormap to ‘summer’ (which is a pre-defined colormap)
Our commands will look like this:
surf(peaks)

colormap winter
Output:
We can change our output back to the default value by simply using the command:
colormap default
2. colormap(map)
We can use this command if we want to set the colormap for our current figure to the colormap specified by the argument ‘map.’
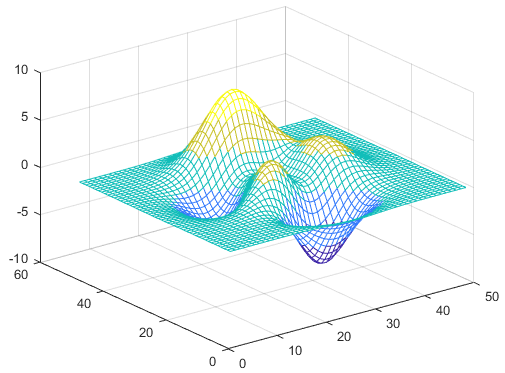
So, as per the table above for colormap codes, let’s use ‘parula’ as our colormap and use 5 as the number of colors we want to use out of the ‘parula’ colormap.
Our command will look like this:
mesh(peaks)colormap(parula(5))
Output:
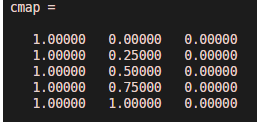
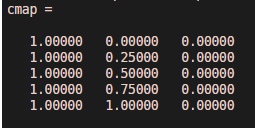
3. cmap = colormap
This command returns the colormap for our current figure as a 3-column matrix utilizing RGB triplets. Each row of the matrix will be an RGB triplet color value that will specify one color of the colormap.
Our command will be like this:
cmap = colormap
Output:
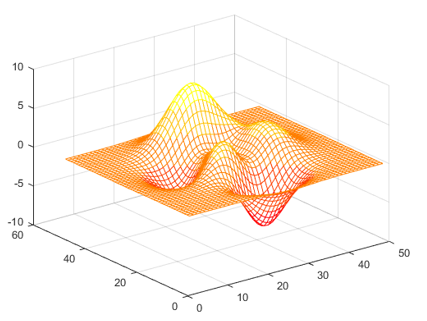
To understand this, let’s first create a surface plot with some colormap:
mesh(peaks)

colormap(autumn (5))
Output:
Now if we pass the command:
cmap = colormap;
Output:
Conclusion
MATLAB is a system that utilizes arrays as its basic data element. You must be familiar with the point that arrays do not require any dimensioning, thus enabling MATLAB to solve problems related to computing, especially those involving matrix & vector formulations with better performance.
In addition to its computing powers, MATLAB also allows its users to draw and visualize the data for better understanding and inferences.
All these capabilities are achieved by MATLAB in significantly less amount of time when its performance is compared to a non-interactive programming language like C.
Recommended Articles
This is a guide to Colormap in Matlab. Here we discuss the introduction, RGB Triplets, and the examples of Colormap in Matlab. You can also refer to our other related articles to learn more –
