Updated March 23, 2023
Introduction to Colors in Matlab
In this article, we will learn Colors in Matlab. MATLAB or Matrix Laboratory is a programming language that was developed by MathWorks. This powerful language finds its utility in technical computing. MATLAB provides us with a convenient environment that can be used to integrate tasks like manipulations on matrix, plotting data and functions, implementing algorithms, creating user interfaces, etc. MATLAB is also convenient as it gives the solutions in the form that its user can easily understand. It uses mathematical notations to display the solutions.
Where can we Use Matlab?
Below are a few areas where we can use Matlab:
- Computation
- Development of Algorithms
- Modeling
- Simulation
- Prototyping
- Analysis and Visualization of data
- Scientific Graphs
- Engineering Graphics
- Developing Applications
MATLAB comprises a number of techniques and functions to perform the above-mentioned capabilities. The objective of this article is to have a thorough understanding of Colors in MATLAB. As the name suggests, the purpose of colors in MATLAB is to plot the graph of a function with the desired color. First, we use plot function to create a graphical representation of our data and then we use a specific code to get the graph of the desired color. It is straightforward and easy to visualize a trend in data when it is plotted as compared to just looking at the raw figures and color-coding gives it an even stronger appeal. For example, red color can be used to show negative trends in some data and green to show positive trends. It is simple to draw an inference in this case as we mostly associate the red color with danger or word of caution.
What Color Codes Use in Matlab Plot?
Below is the list of some letters which we can add to our code to provide the desired color to our plot while plotting in MATLAB.
- b: blue
- g: green
- r: red
- c: cyan
- m: magenta
- y: yellow
- k: black
- w: white
Examples to Implement Colors in Matlab
Let us now understand the use of some of the above-mentioned colors:
Example #1
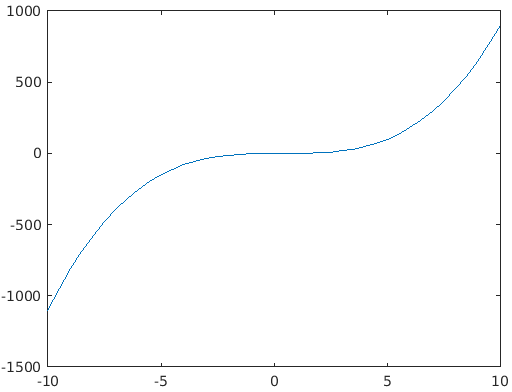
First, we will plot a graph and will let MATLAB plot it with default color:
Code:
X = -10 : 0.5 : 10;

Y = x. ^3 - x. ^2;

plot (x, y)
Output: The output for this function will be in ‘BLUE’ color by default as shown in the below graph.
Now let us convert it into colors of our wish.
Example #2
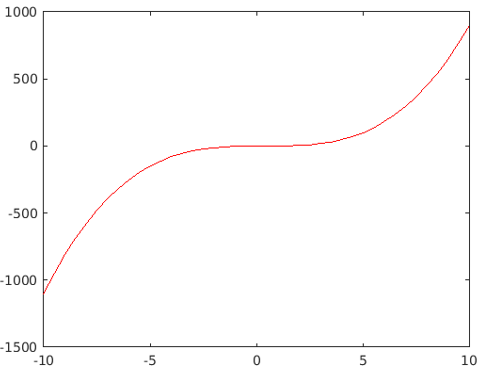
To convert our graph into ‘RED’ color we will simply add ‘r’ to out code, as follows:
Code:
X = -10 : 0.5 : 10;

Y = x. ^3 - x. ^2;

plot (x, y, ‘r’)
Output: Now, the output will be the same as above but this time in ‘RED’ color, as shown in the below graph:
Example #3
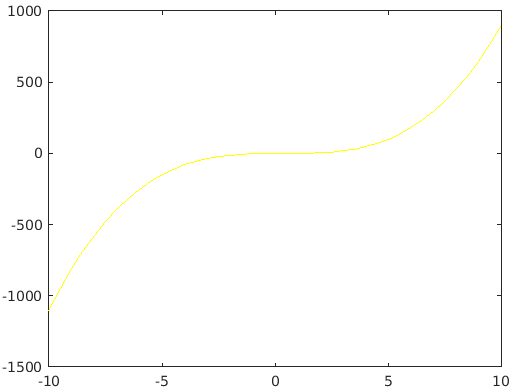
Finally, let us try it for YELLOW color. So as explained previously, we will simply replace ‘r’ in our code with ‘y’ for YELLOW color.
Code:
X = -10 : 0.5 : 10;

Y = x. ^3 - x. ^2;

plot (x, y, ‘y’)
Output:
Example to Change the Style in Matlab
Further, if we wish to change the style of our plot, we can further tweak our code to get the desired result. To achieve this, we will subscript the color letter in our code with one of the following codes to get the desired style:
- . : Point
- o: Circle
- x: X-Mark
- +: Plus
- s: Square
- *: Star
- d: Diamond
- v: Triangle (down)
- ^: Triangle (up)
- <: Triangle (left)
Example #4
We will use the code that we use above for RED color.
Code:
X = -10 : 0.5 : 10;

Y = x. ^3 - x. ^2;

plot (x, y, ‘r’)
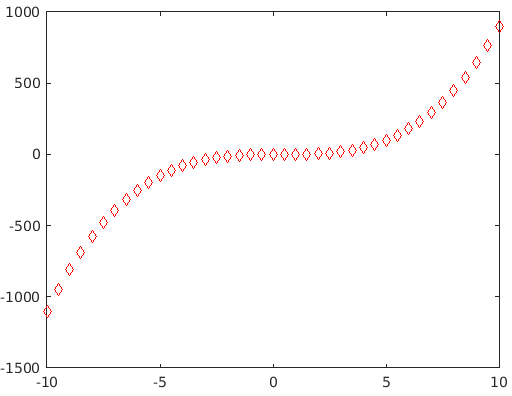
Now, let us assume that we need our plot to be of diamond shape, so, as explained above, we will subscript ‘r’ with ‘d’ (because code of diamond is ‘d’). Our final code will be:
Code:
X = -10 : 0.5 : 10;

Y = x. ^3 - x. ^2;

plot (x, y, ‘dr’)
Output:
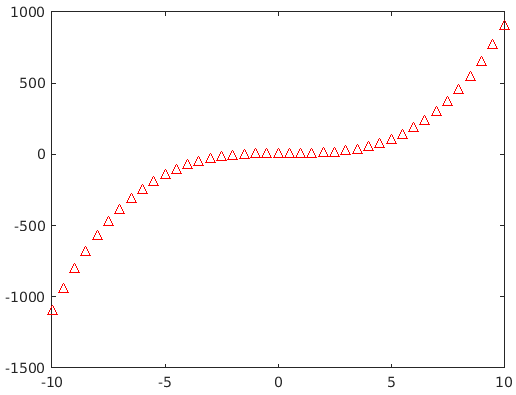
Similarly, if we need to have our plot in the shape of triangles facing upward, we will subscript or color code with ‘^’ which is the code for upward-facing triangles.
Code:
X = -10 : 0.5 : 10;

Y = x. ^3 - x. ^2;

plot (x, y, ‘^r’)
Output:
Conclusion
MATLAB as a system utilizes arrays as its basic data element. As you must be familiar with the point that arrays do not require any dimensioning, and thus enabling MATLAB to solve problems related to computing, especially those involving matrix & vector formulations with better performance. In addition to its computing powers, MATLAB also provides its users with the ability to draw and visualize the data for better understanding and drawing inferences. All these capabilities are achieved by MATLAB in significantly less amount of time when its performance is compared to a non-interactive programming language like C.
Recommended Articles
This is a guide to Colors in Matlab. Here we discuss where and how to use the Colors in Matlab with different examples implementing it. You can also go through our other related articles to learn more –
