Updated February 27, 2023

Introduction to Matlab Plot Colors
MATLAB provides us with plenty of functionalities, useful in various computational problems. Apart from its computational capabilities, MATLAB is also a great tool for visualization. It provides us with the ability to create a wide variety of plots. In this article, we will focus on how to obtain plots of the required colors.
As we are aware, we can have multiple functions plotted in a single figure; colors help us to differentiate between these functions. In MATLAB we use pre-defined color codes to get plots of desired colors.
TABLE for Color Codes
Below is the color table code as follows:
| Color | Code |
| Red | r |
| Blue | b |
| Cyan | c |
| Black | k |
| Green | g |
| White | w |
| Magenta | m |
| Yellow | y |
Examples to Implement Matlab Plot Colors
Let us start by taking the example of 2 functions created in the same plot.
Example #1 – 2 functions
Syntax
Defining our functions:
X = linspace(-2*pi,2*pi)

a = sin (X)

b = cos (X)
- [Defining 100 equally distant points]
- [Defining our first function: sin function]
- [Defining our second function: cos function]
Observe in the code that we have passed pre-defined color codes as arguments (Please refer to the table at the end of the article for pre-defined color codes)
Input:
X = linspace(-2*pi,2*pi)

a = sin (X)

b = cos (X)

figure

plot(X, a, 'g', X, b, 'b')
Output:
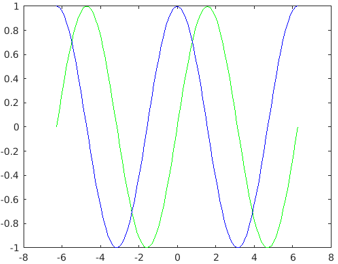
Explanation: Observe in the output that we have obtained our functions in the colors as expected.
Example #2 – 3 functions
Let us next take an example of 3 functions created in the same plot.
Syntax
Defining our functions:
X = linspace(-2*pi,2*pi)

a = sin (X)

b = cos (X)

c = X
- [Defining 100 equally distant points]
- [Defining our first function: sin function]
- [Defining our second function: cos function]
- [Defining our third function: a straight line]
Observe in the code that we have passed pre-defined color codes as arguments (Please refer to the table at the end of the article for pre-defined color codes)
How our input and output will look like in MATLAB console?
Code:
X = linspace(-2*pi,2*pi);

a = sin (X);

b = cos (X);

c = X

figure

plot(X, a, 'g', X, b, 'b', X, c, 'y')
Output:
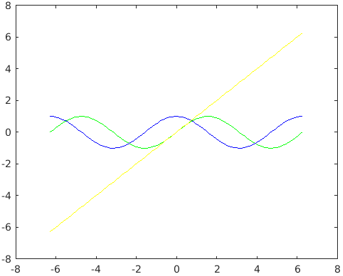
Explanation: As we can see in our output, we have got our functions in the colors as passed by us in the input.
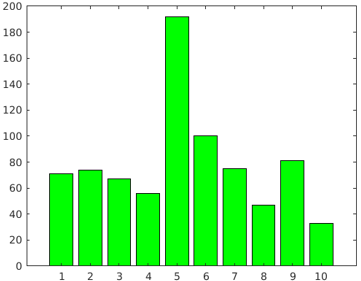
How to Set the Color of Bar Plots?
For this example, we will create a bar plot with bars of green color.
Syntax
Let us first define an array to create a Bar plot:
[71 746756 192 1007547 8133 ]
bar (X, ‘g’)
- [Defining the array]
- [Plotting our bar plot]
Observe in the code that we have passed pre-defined color code for green as an argument (Please refer to the table at the end of the article for pre-defined color codes)
Code:
X = [71 74 67 56 192 100 75 47 81 33 ]
bar (X, 'g'
Output:
How to Set Color of Scatter Plots?
For this example, we will scatter plot of red color
Syntax:
a = linspace(0, 2*pi,100)

b = cos (a) + rand (1, 100)

scatter (a, b, ‘r’)
- [Defining 100 equally distant points]
- [Defining our cos function]
- [Plotting our scatter plot]
Observe in the code that we have passed pre-defined color code for red as an argument (Please refer to the table at the end of the article for pre-defined color codes)
Code:
a = linspace(0, 2*pi,100);

b = cos(a) + rand(1,100);

scatter(a, b, 'r')
Output:
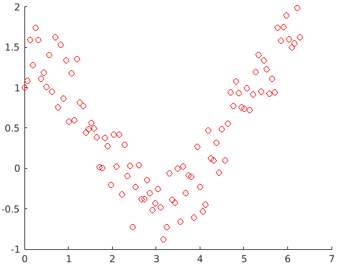
Observe in the output that we have obtained a scatter plot of red color, as passed by us in the input argument.
Conclusion
MATLAB can be used to plot our data for visualizing and intuitively understanding it. There could be instances when we have to plot multiple functions in a single plot, in such cases, colors become very handy to differentiate between different functions.
Recommended Articles
This is a guide to Matlab Plot Colors. Here we discuss an introduction to Matlab Plot Colors, along with color code table and respective examples. You can also go through our other related articles to learn more –
